
Member @jrandhawa posted the following request in the trading room:
Randy Please discuss the charts of 2yr & shorter duration treasuries relative to 10yr treasury too.
Thanks in advance.
Even if one has little to no desire to trade or invest in treasury bonds, most experienced stock traders & investors will keep one eye on the bond market at all times as it can often provide clues as to where the stock market might be headed. Certain developments such as an increase or decrease in credit spreads (the differential in rates between treasuries & lower quality corporate bonds such as junk bonds), a steepening or flattening yield curve, a sudden & stark increase in buying of treasury bonds without any apparent cause for a rise or fall in interest rates as possible flight-to-safety by the “smart money” (institutions, etc..), etc. are some of the clues that the bond market can provide as a early warning of potential cracks forming in a stock market rally.
Unlike all but the highest quality investment grade corporate municipal bonds, treasury bonds have little to no default risk affecting their prices so other than the occasional flight-to-safety bid (& subsequent unwinding or selling of treasuries after the real or perceived risks in the market abate), the primary driver of treasury bond prices is rising or falling interest rates.
Basically, the shorter the maturity, the less treasury prices are affected by rising or falling rates. Two year & shorter maturity treasuries (T-Bills) have very little interest rate sensitivity & there is a fairly consistent increase in rate sensitivity as you move out towards the end of the maturity spectrum on US treasury bonds (30 yrs max.). As with just about any financial instrument, there are a lot of variables that come into play but essentially, the longer the maturity, the higher the interest rate & the higher the price fluctuations of that bond will be until maturity (when it will pay out a 100% of face value). As such, one could park funds into short-term treasury bonds if they wanted relative liquidity & slightly better rates than a money market fund. Longer-term treasuries, such as the 10-30 year T-notes & Bonds that IEF & TLT hold, are used by individual & institutional investors (mutual funds, pension plans, etc..) as safe way to earn interest on long-term funds but also as trading vehicles, due to the price swings from the above mentioned factors.
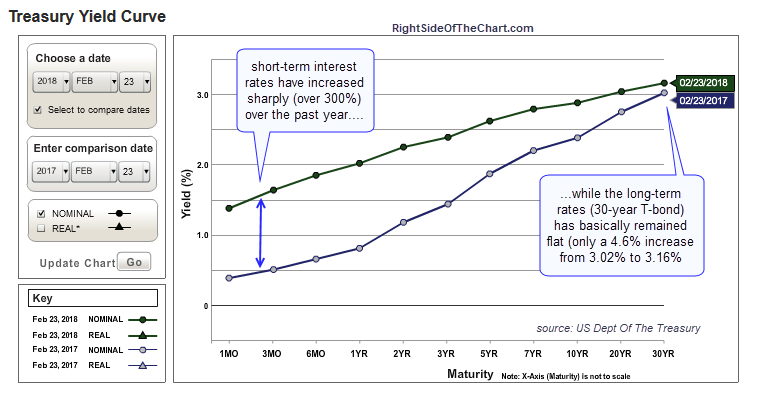
Treasury Yield Curve Feb 26, 2018
Note sure if that answers your question(s) and if not, just let me know. Here’s a link to the US treasury yield curve which plots the current interest rates on the entire spectrum of short-term T-Bills out to the 30-yr T-bond. As evidenced in the chart above, the yield curve has been flattening recently, largely a result of short-term rates rising due to the actual & expected future rate hikes from the Fed plus the fact that long-term rates have essentially remain flat, which is typically due to the markets expectation for low growth and/or low inflation expectations in the longer-term. While the yield curve is still positive (i.e.- upwards sloping), the recent trend of a flattening yield curve is worth monitoring as it should be noted that each of the previous four recessions were preceded by an inversion of the yield curve, which occurs when long-term rates fall below short-term rates.