
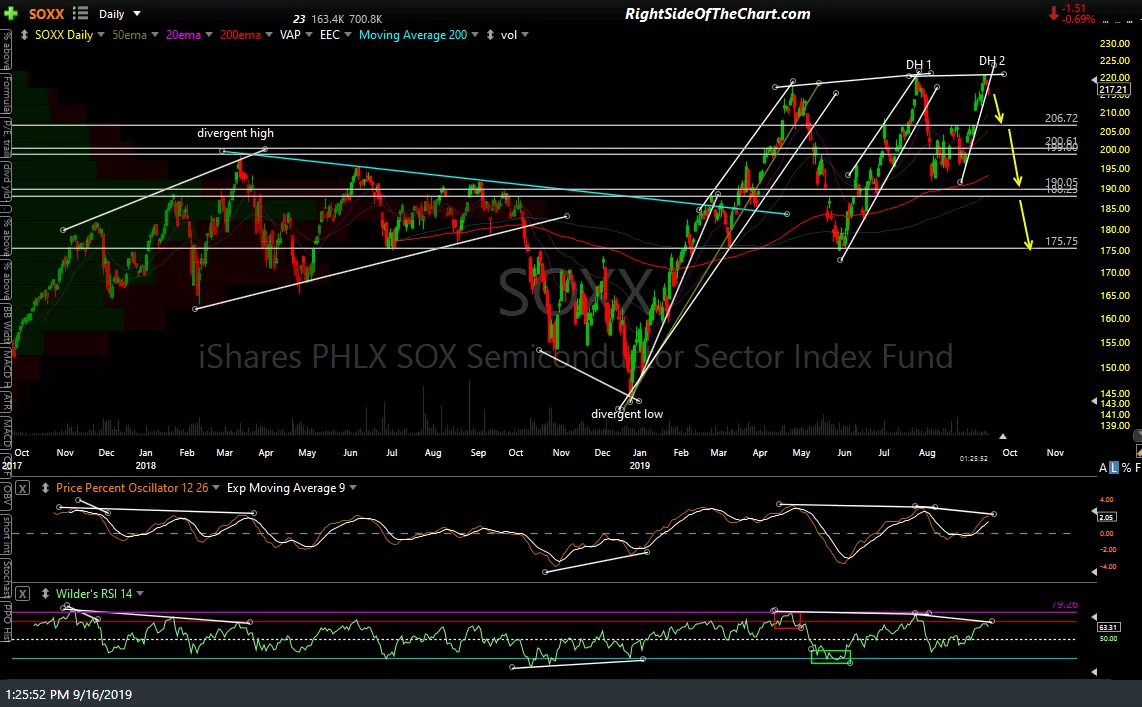
Member @point2 requested an update on the semiconductor sector in the trading room & I figured that I’d share my analysis here. Although I can cover more charts in a video, we’ll keep this one simple & post the daily charts of SOXX (semiconductor sector ETF which tracks the same index as the 3x leveraged SOXS & SOXL) along with some of the top components of the sector, all of which are at or near resistance with negative divergence on the indicators. Essentially, it appears to me that the upside on the semiconductor sector is very limited although whether these stocks fall to the targets on these charts will most likely depend on whether or not the major stock indices, especially the Nasdaq 100, break down soon as well.
-

- SOXX daily Sept 16th
-

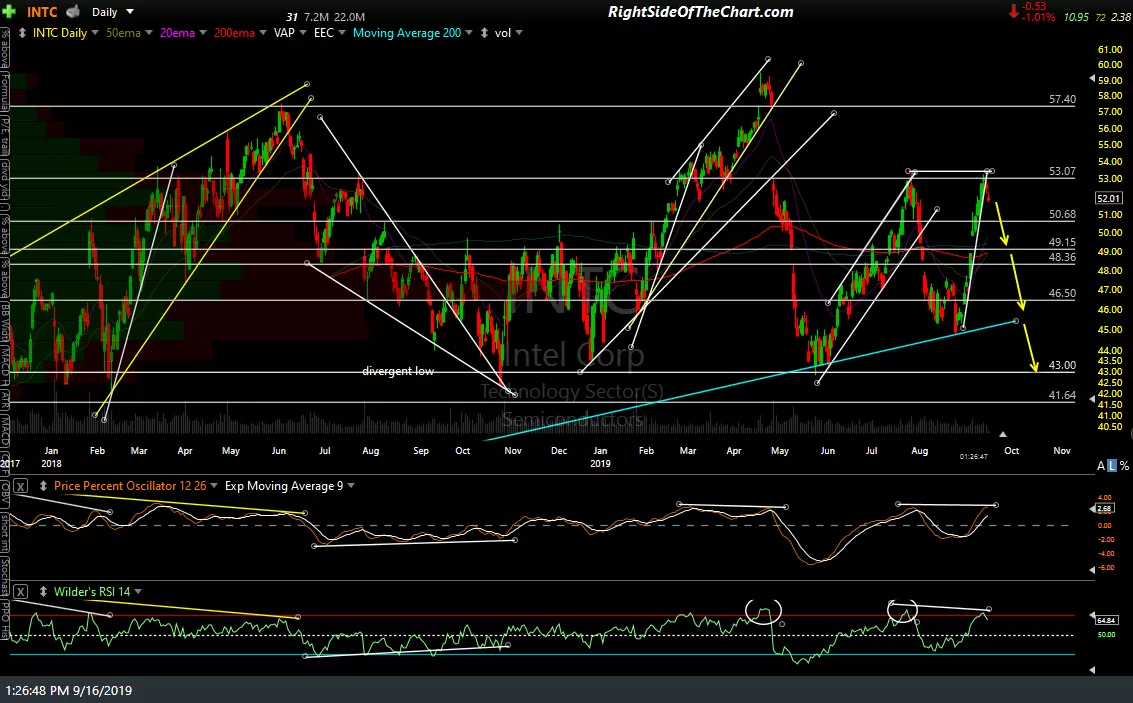
- INTC daily Sept 16th
-
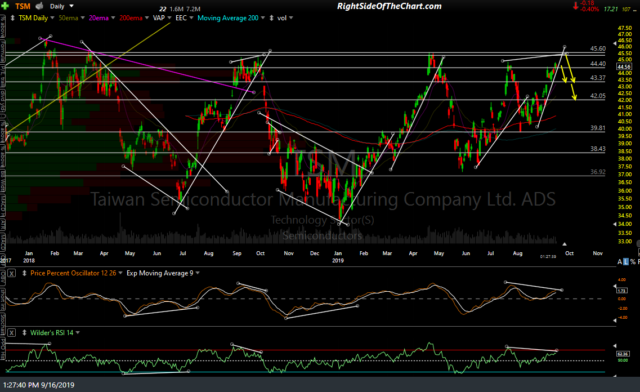
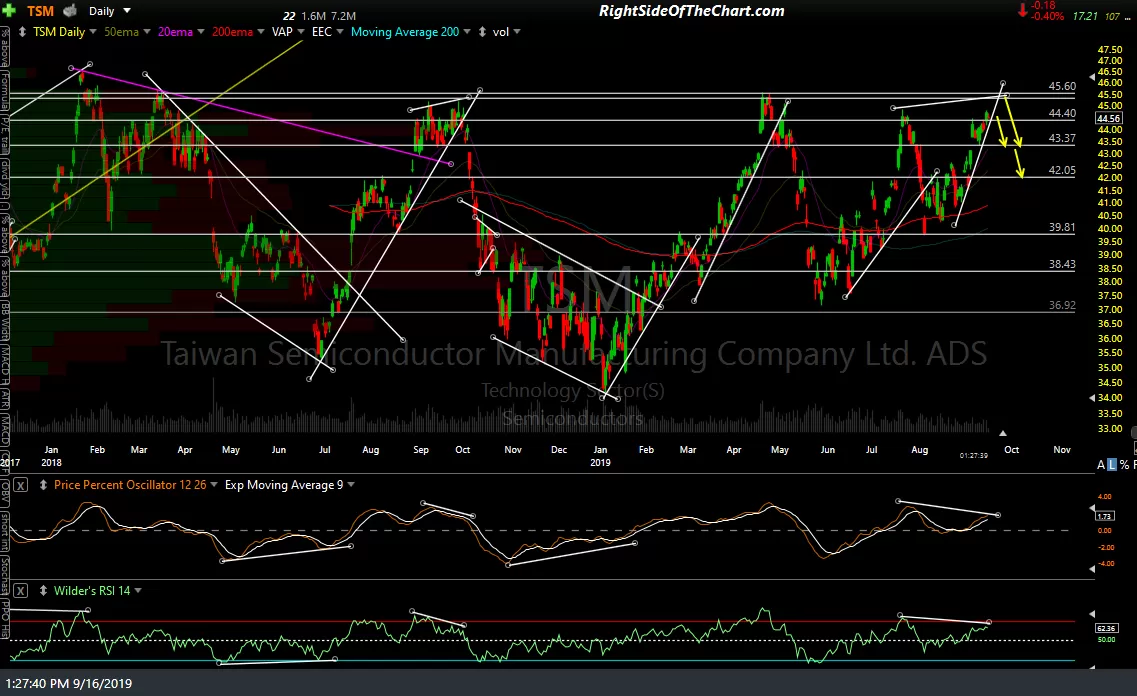
- TSM daily Sept 16th
-
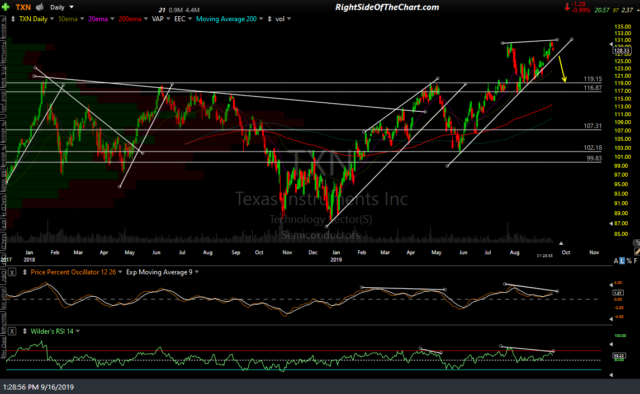
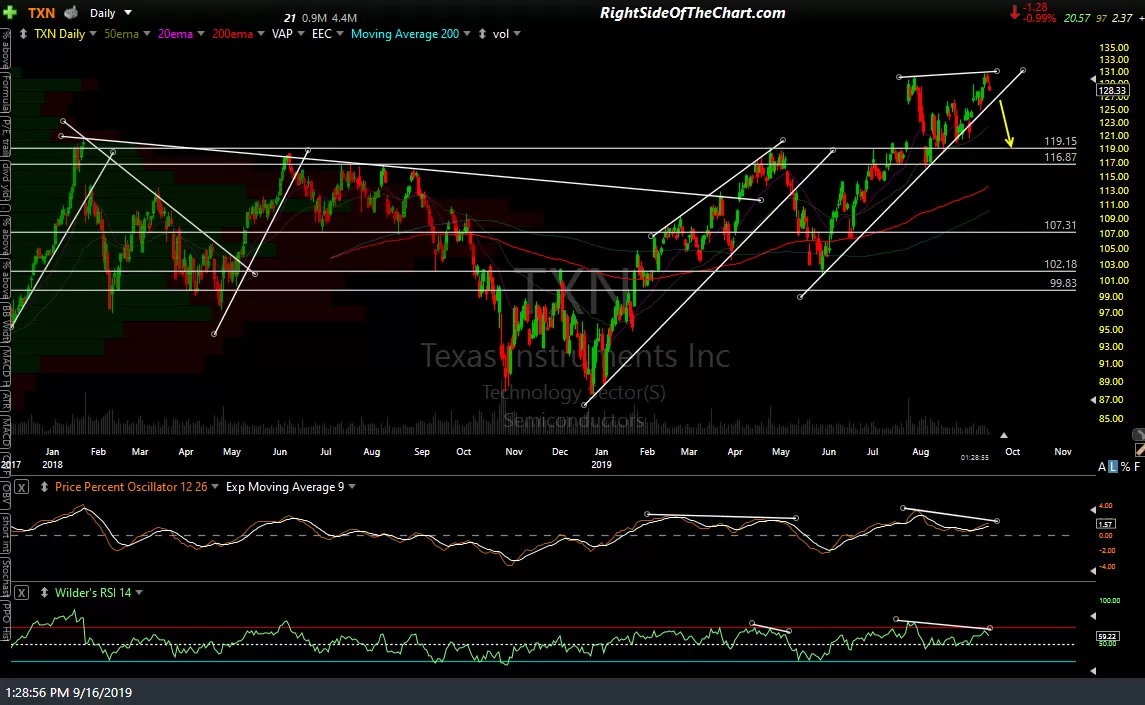
- TXN daily Sept 16th
-
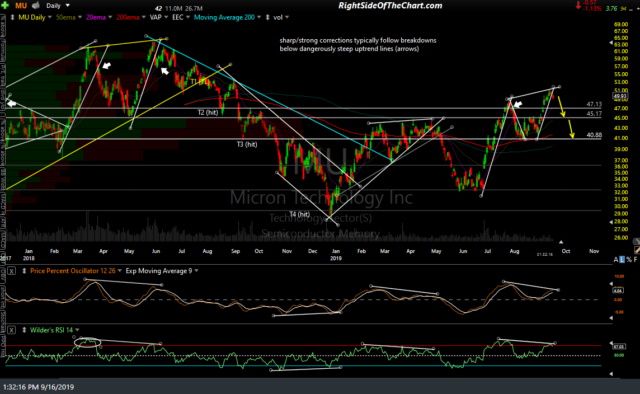
- MU daily Sept 16th

-
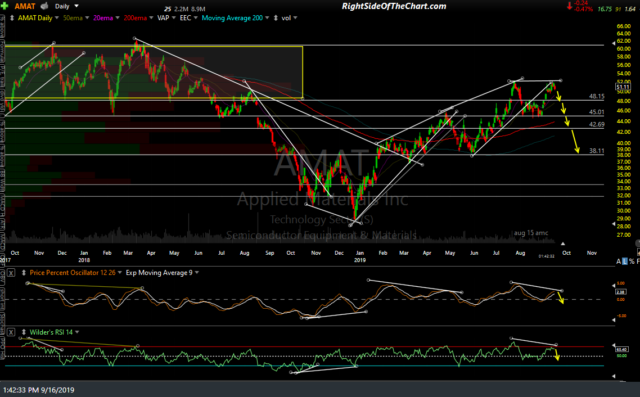
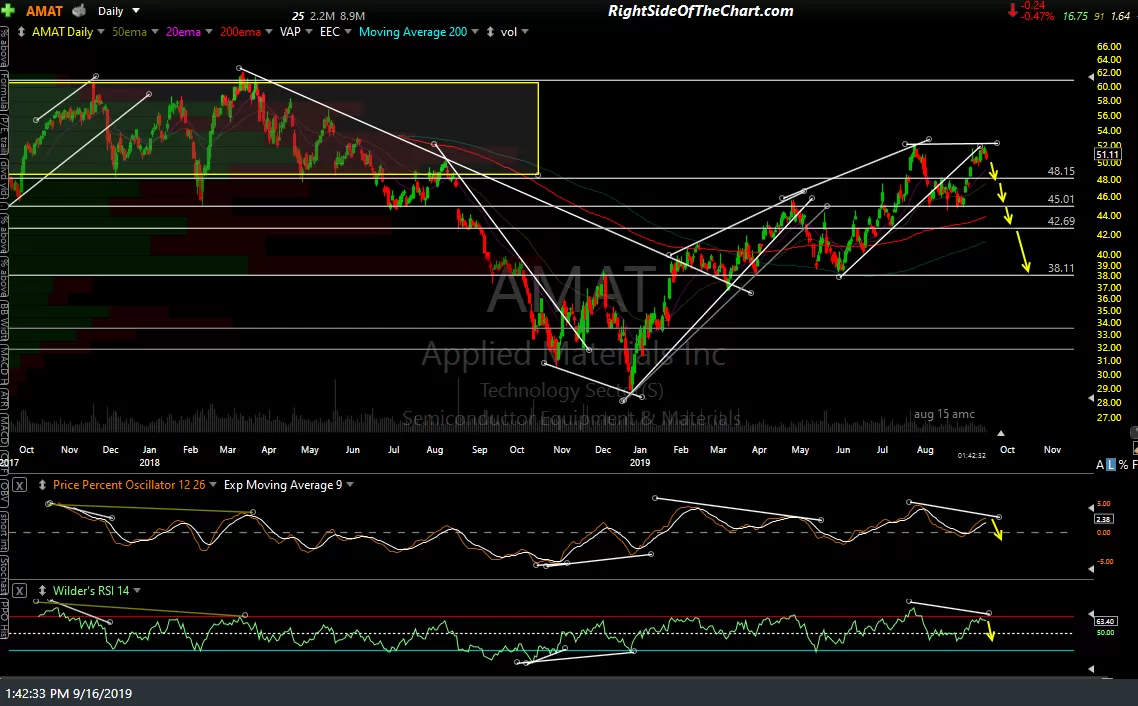
- AMAT daily Sept 16th
Click on the first chart to expand, then click anywhere on the right of the chart to advance to the next chart. Once expanded, charts can be panned & zoomed. Multiple charts in a gallery format, as above, will not appear on the subscriber email notifications but may be viewed on the site by clicking the title of the post in the email notification.