I just wanted to pass along that this tag of the 11893 resistance & price target (which was added during today’s earlier video) looks like an objective level to close /NQ longs & reverse to a short for a pullback trade (targets at arrow breaks) for active traders.
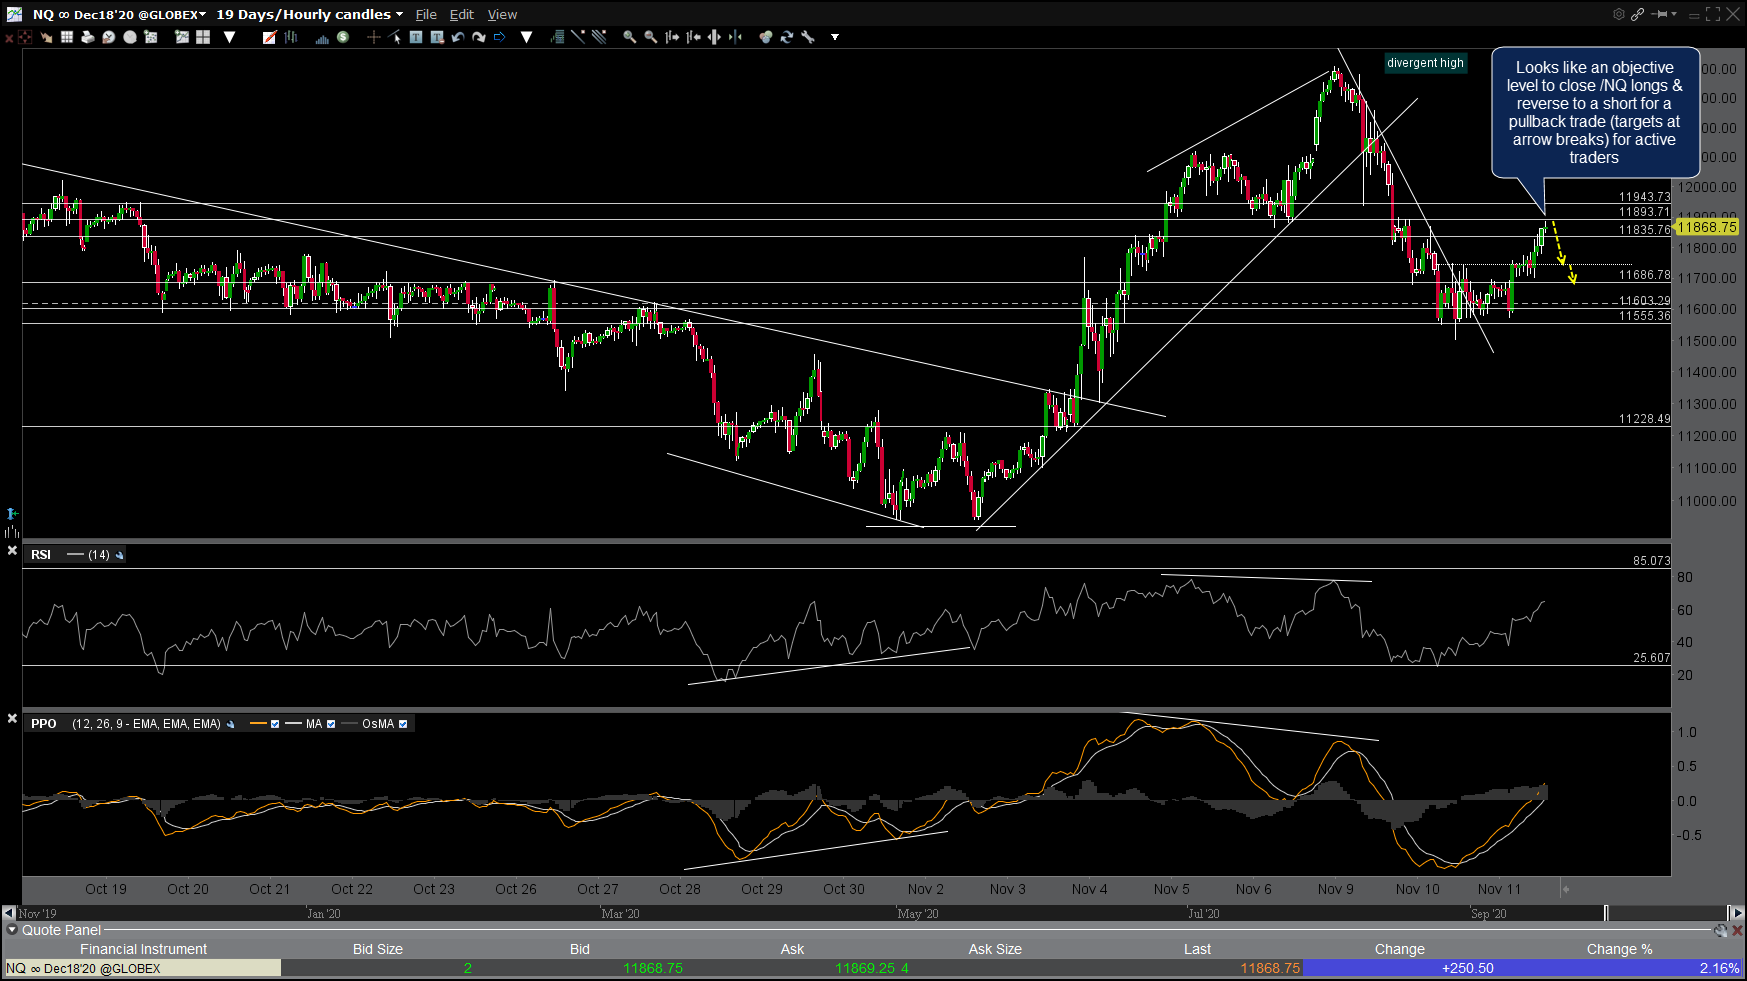
NQ 60m 2 Nov 11th
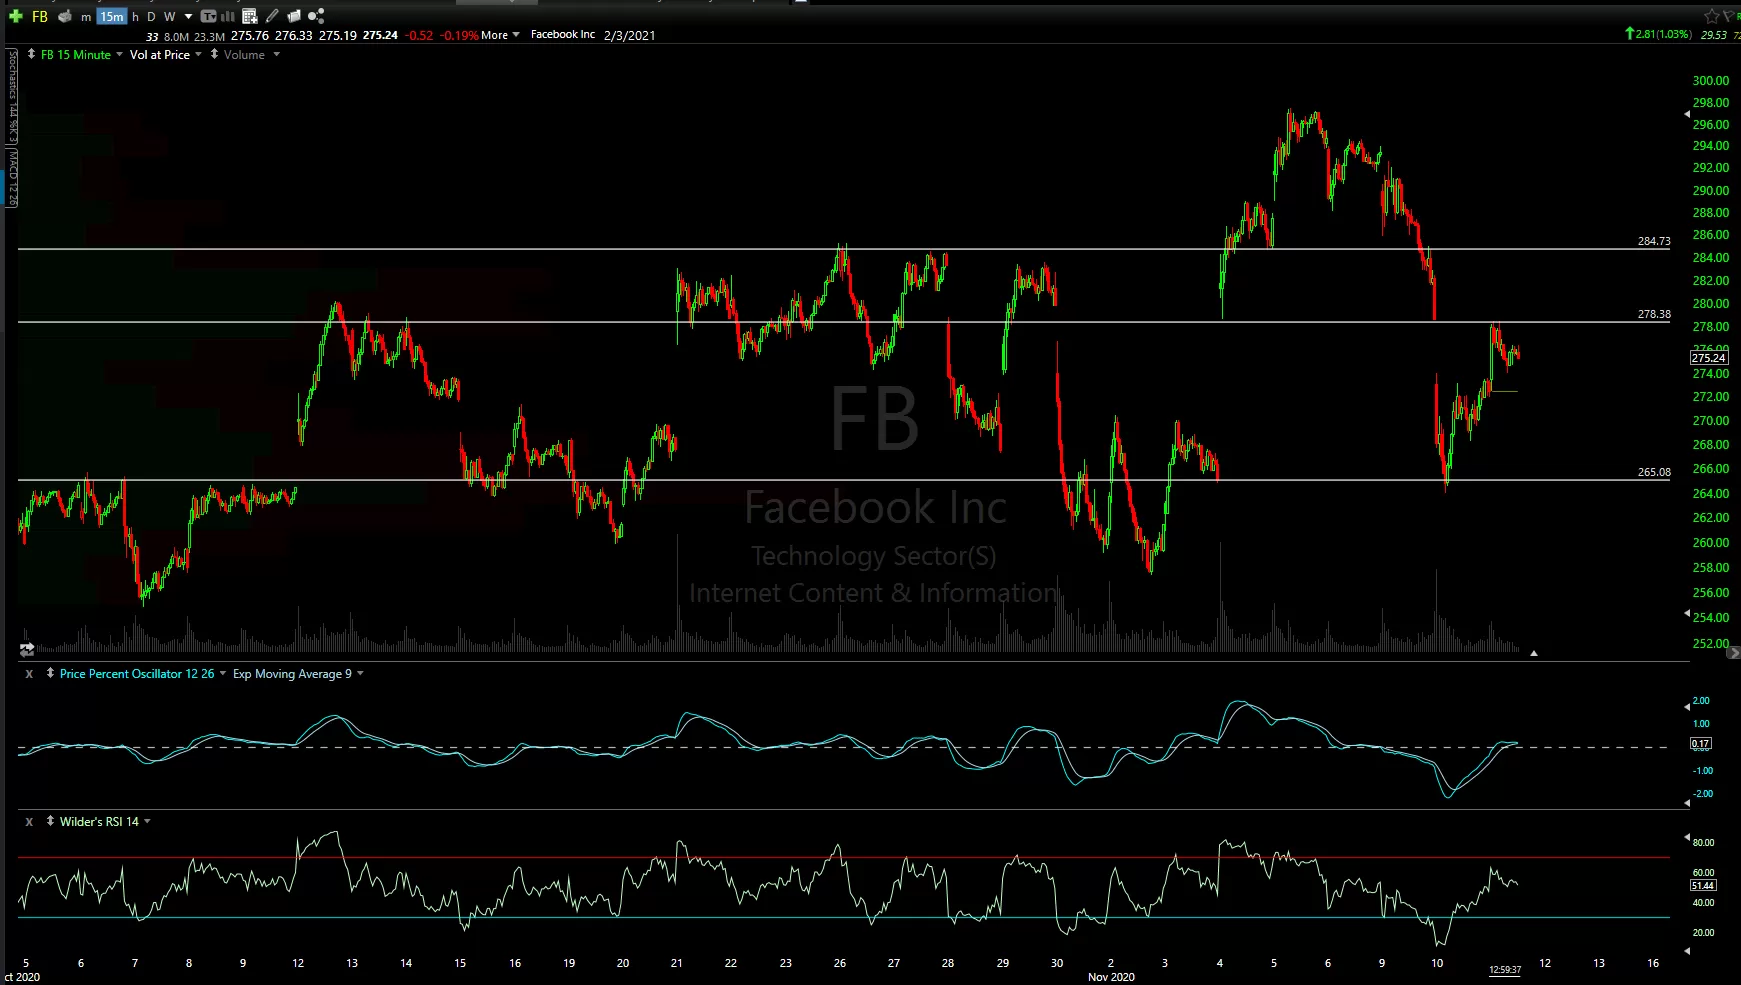
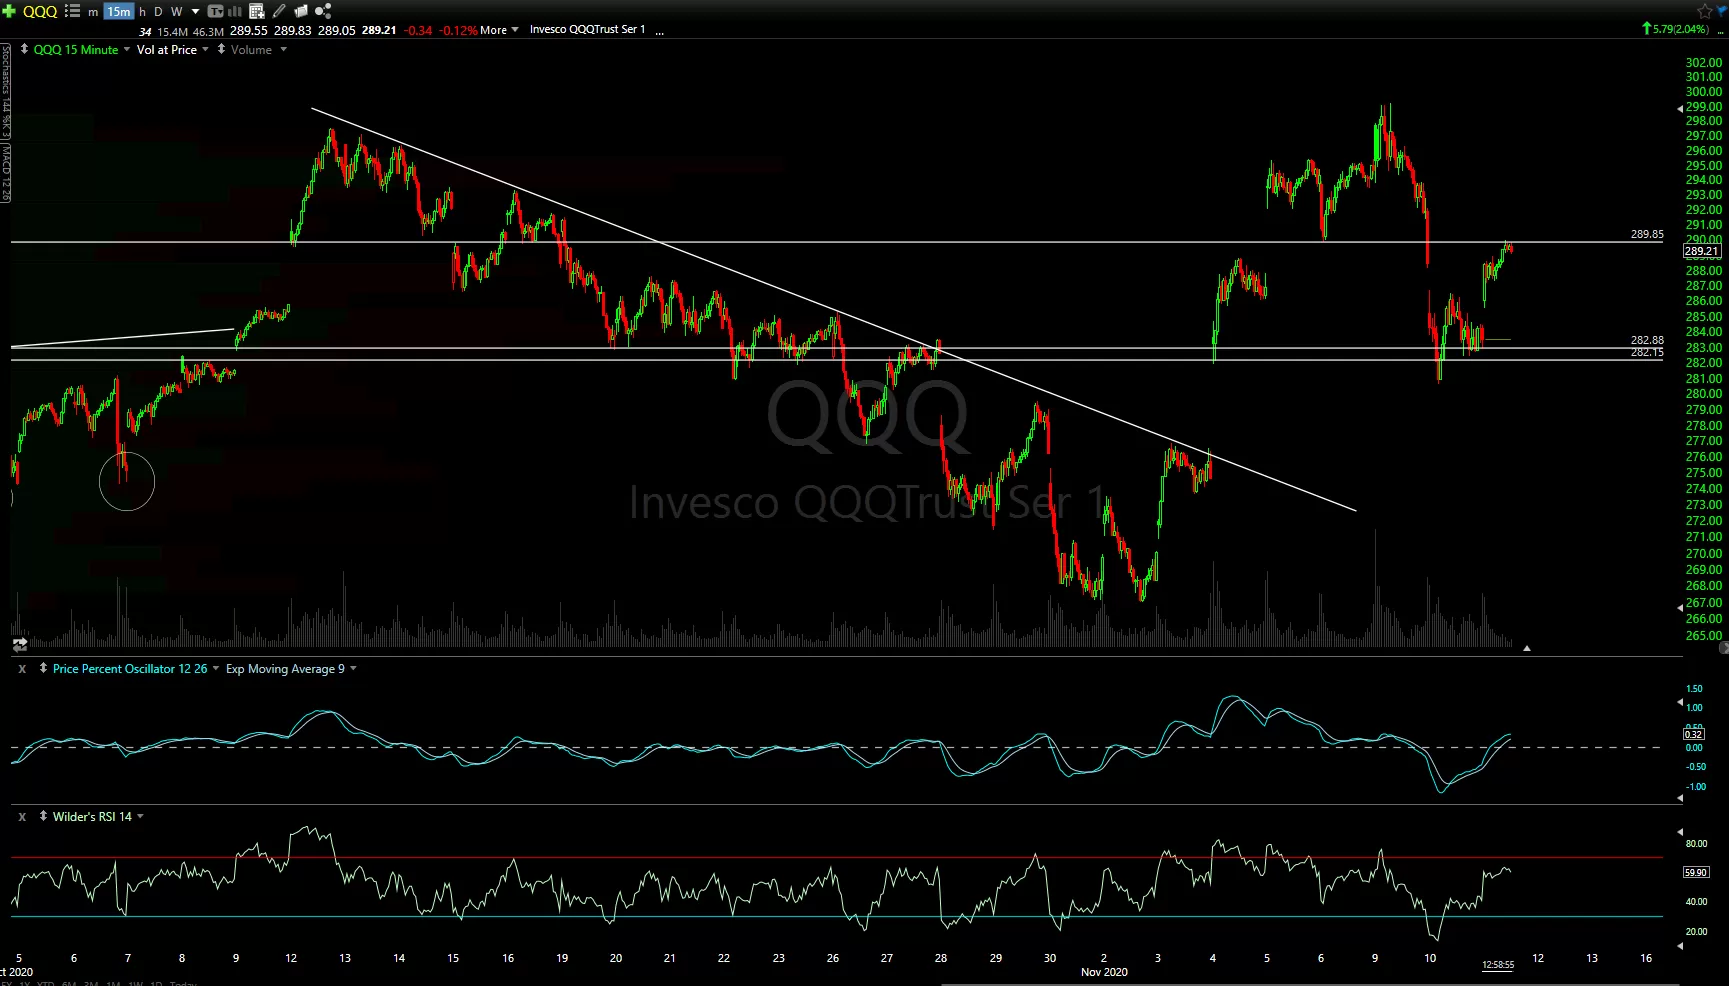
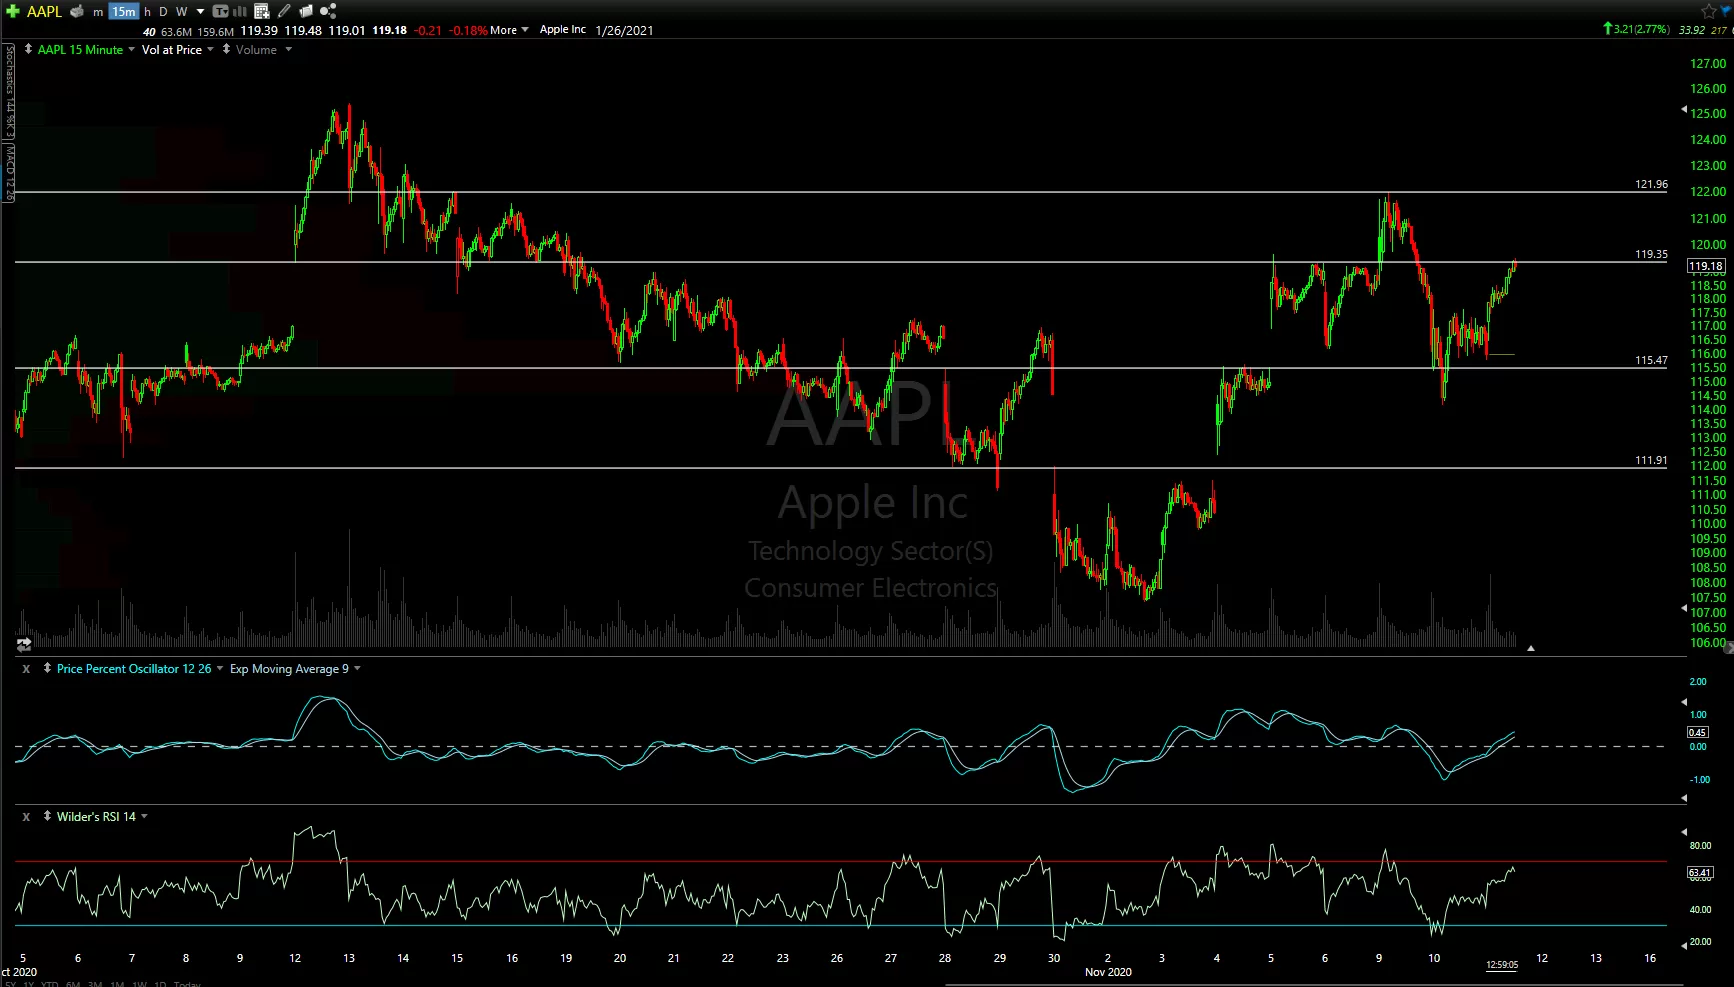
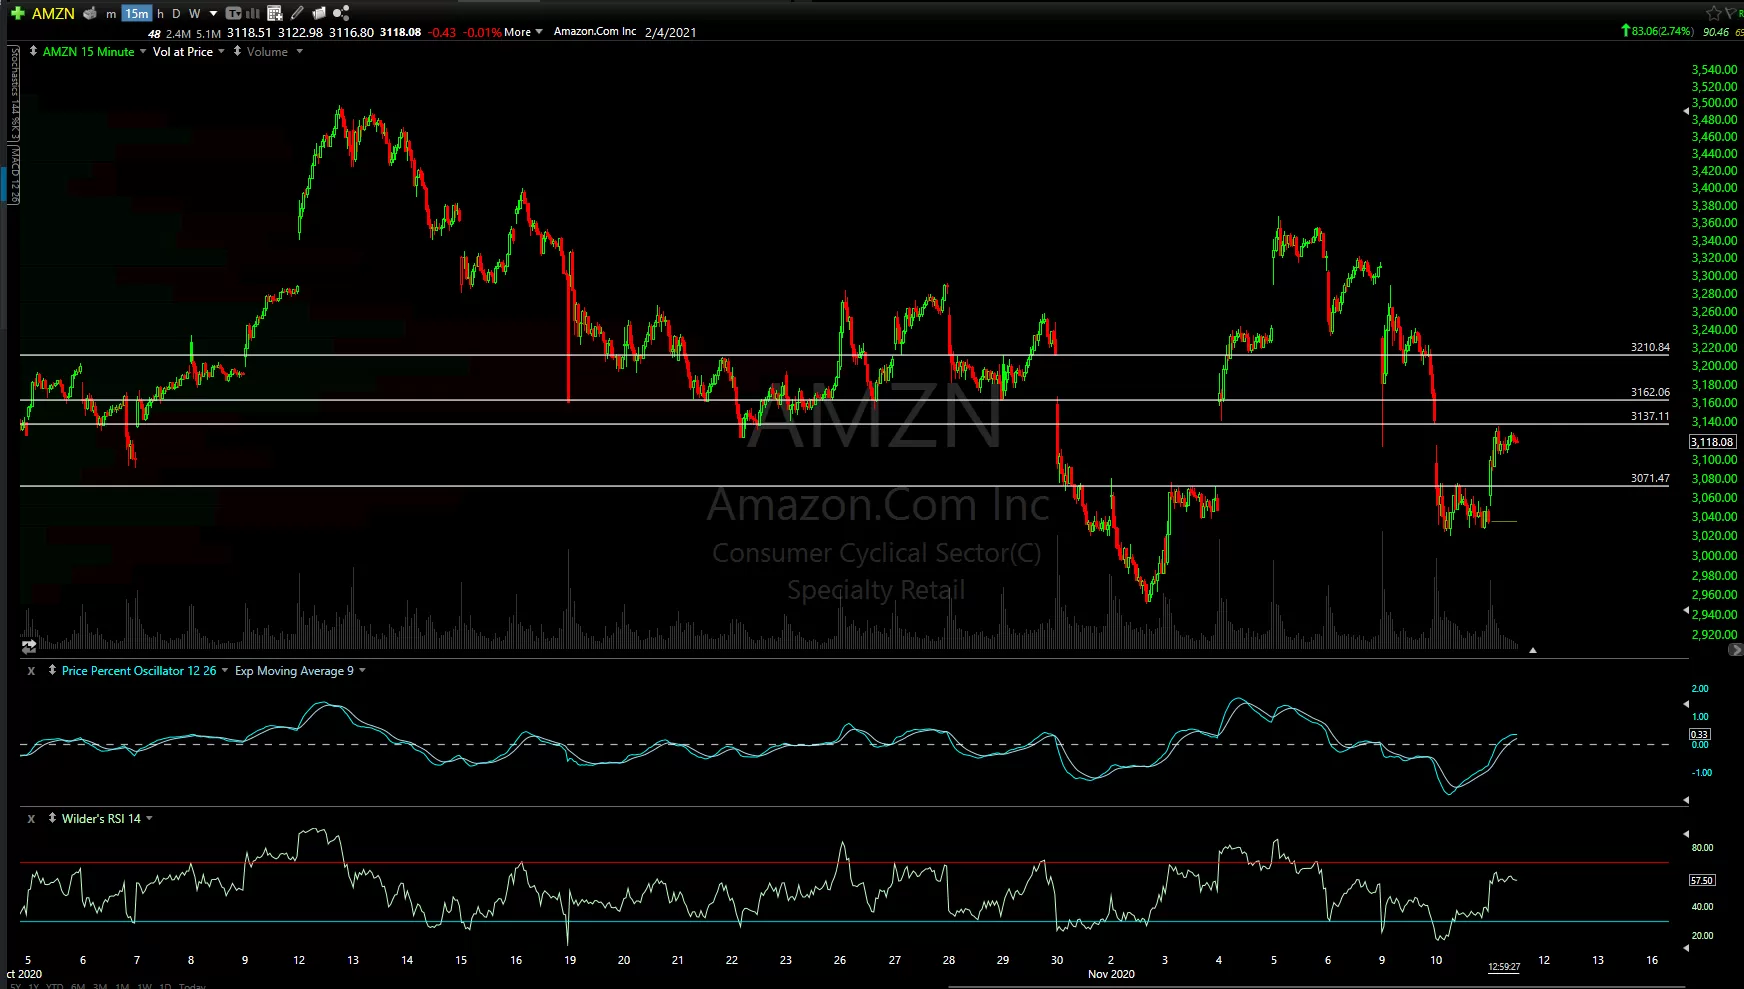
Overall, the recent price action on the daily charts (as covered in today’s video) has been & remains bullish. As such, I’m only looking for a relatively minor pullback at this time. Supporting the case for a reaction in the Nasdaq 100 are the following 15-minute charts of QQQ & several of the market-leading FAAMG stocks, all of which have just recently hit resistance, including backfills of several recent gaps.
click on the first chart to expand, then click the arrow to the right to advance to the next expanded chart. Once expanded, charts can be panned & zoomed
-
- QQQ 15m Nov 11th
-
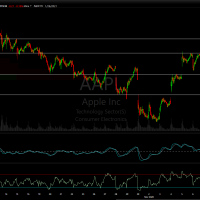
- AAPL 15m Nov 11th
-
- MSFT 15m Nov 11th
-
- AMZN 15m Nov 11th
-
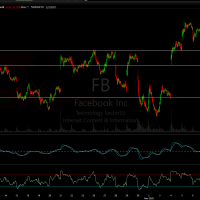
- FB 15m Nov 11th