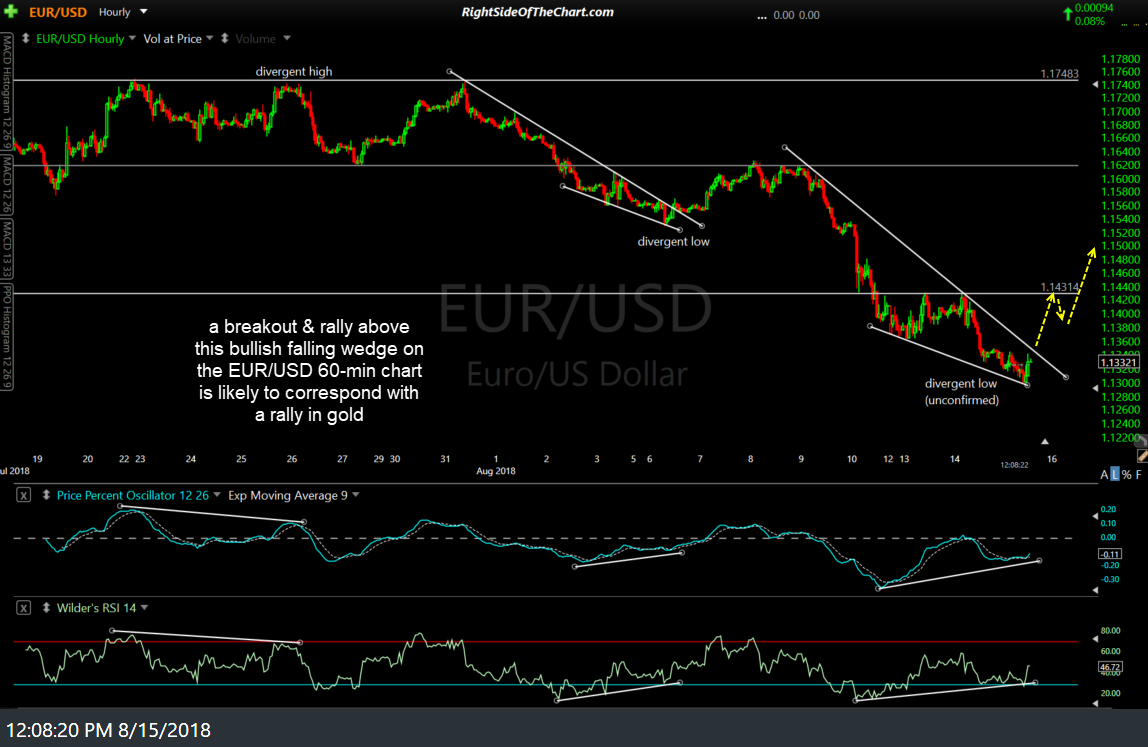
A breakout & rally above this bullish falling wedge on the EUR/USD 60-min chart is likely to correspond with a rally in gold. EUR/USD is also currently backtesting the bottom of the support zone that defined the top of the 2015-2017 basing pattern/trading range.
- EUR-USD 60-min Aug 15th
- EUR-USD weekly Aug 15th
While the Euro is the second largest component of the US Dollar Index at a very top-heavy weighting of 57.6%, the Japanese Yen is the second largest component of the US Dollar Index at a weighting of 13.6%. As recently highlighted, USD/JPY broke down below the uptrend line off the May 29th lows after putting in a divergent high on July 19th. USD/JPY has moved impulsively lower today following yesterday’s backtest of that trendline from below which also follows the recent failed attempt to breakout above the large symmetrical triangle pattern on the more significant weekly time frame.
- USD-JPY daily Aug 15th
- USD-JPY weekly Aug 15th
An additional case can be made for a reversal in the US Dollar as USD/CHY (US Dollar/Chinese Yuan) is currently backtesting this dangerously steep bearish rising wedge pattern following the recent breakdown below it while also trading slightly above the 6.91-6.93ish resistance zone.
Essentially, the U.S. Dollar, along with these major currencies, are at key technical levels. While these support/resistance levels may very well be taken out in the coming days & weeks, should they play out as the charts indicate above, with a meaningful trend reversal (correction) in the U.S. Dollar, that would almost certainly provide the catalyst for a sharp oversold rally in gold & the gold mining stocks.


