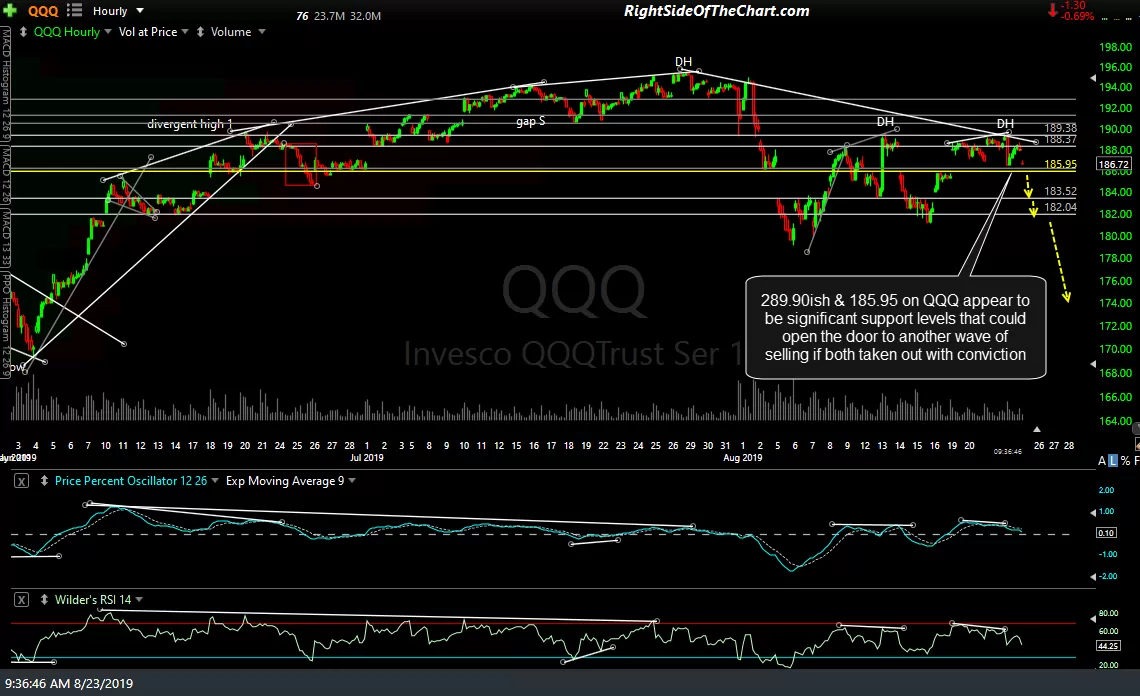
In Friday morning’s post QQQ & SPY Support Levels To Watch, the first two 60-minute charts below highlighted QQQ 185.95 & SPY 289.90 as key support levels which, if broken, could open the door to another wave of selling. That’s exactly what happened with the stock market selling off impulsively as soon as those levels were taken out. (gallery charts below may not appear on email notifications but may be viewed on rsotc.com)
-
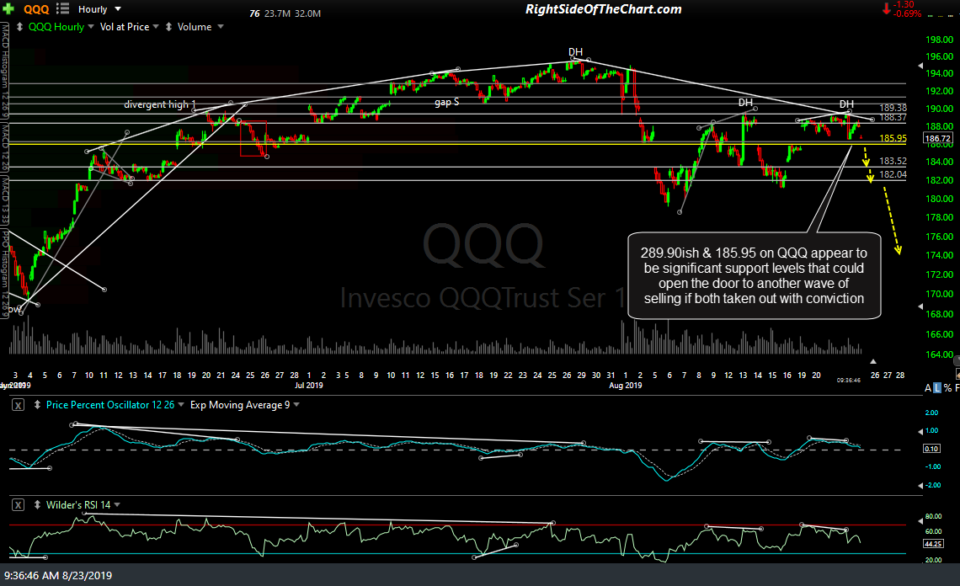
- QQQ 60-min Aug 23rd
-
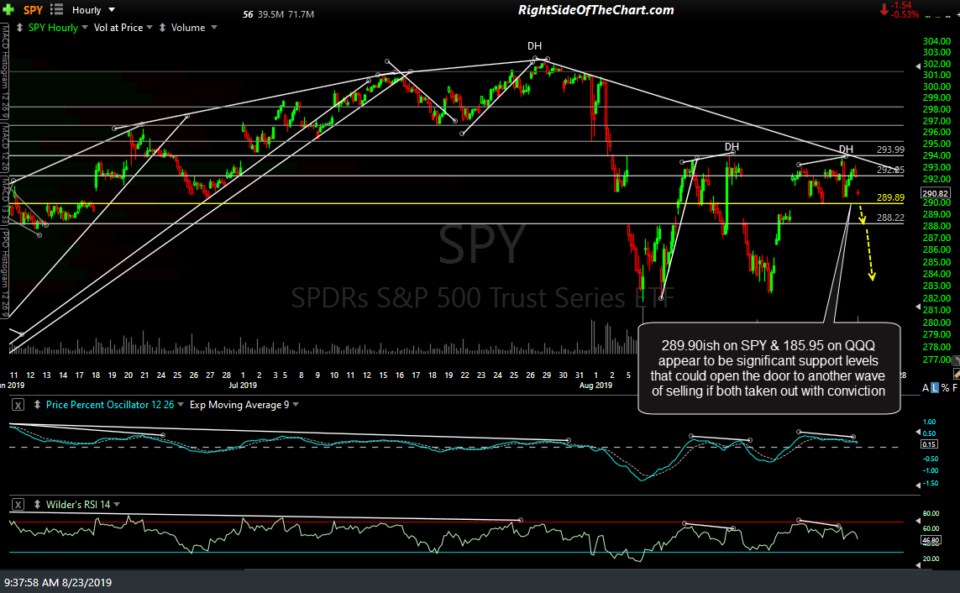
- SPY 60-min Aug 23rd
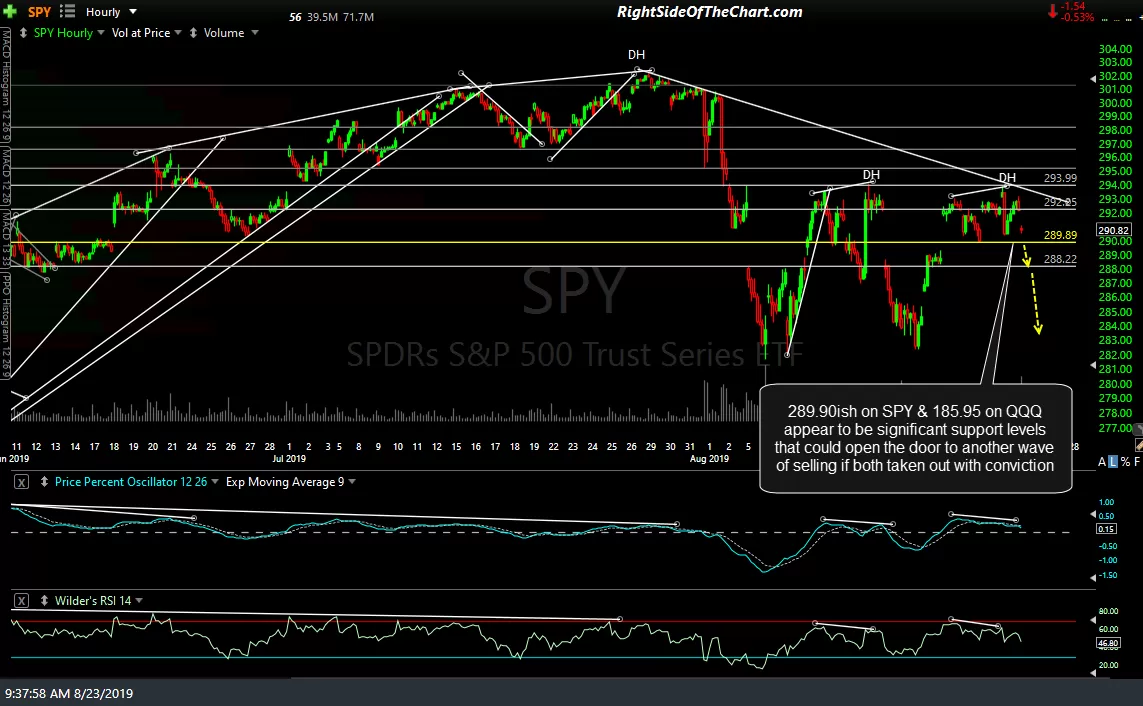
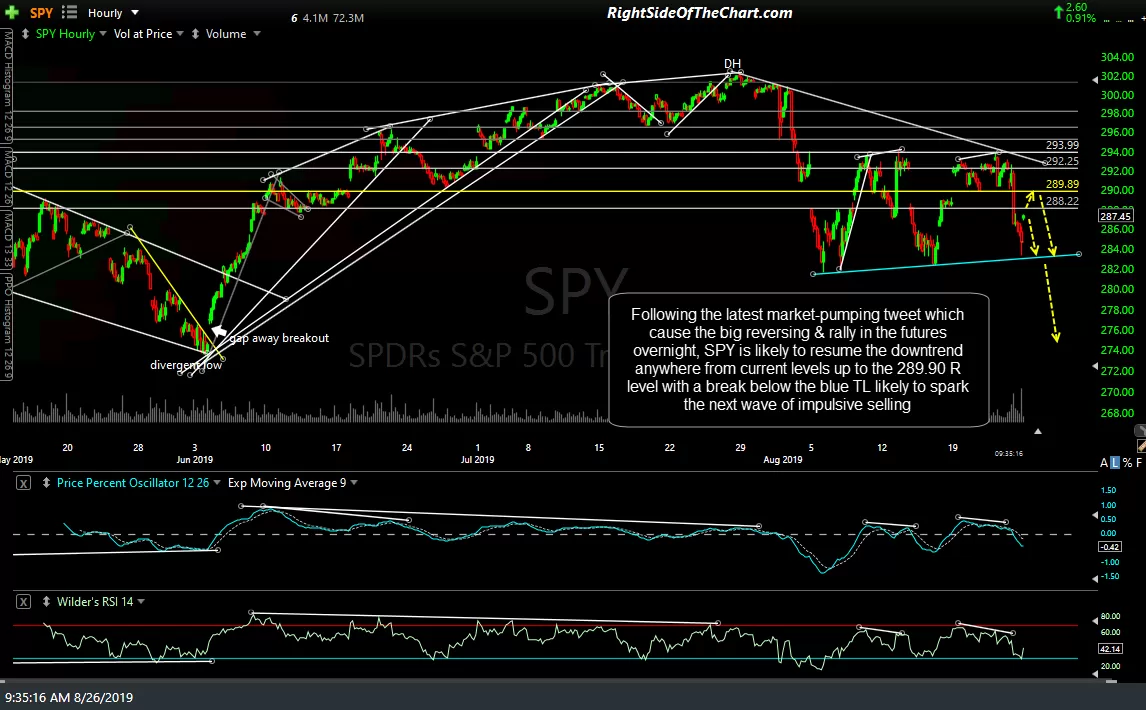
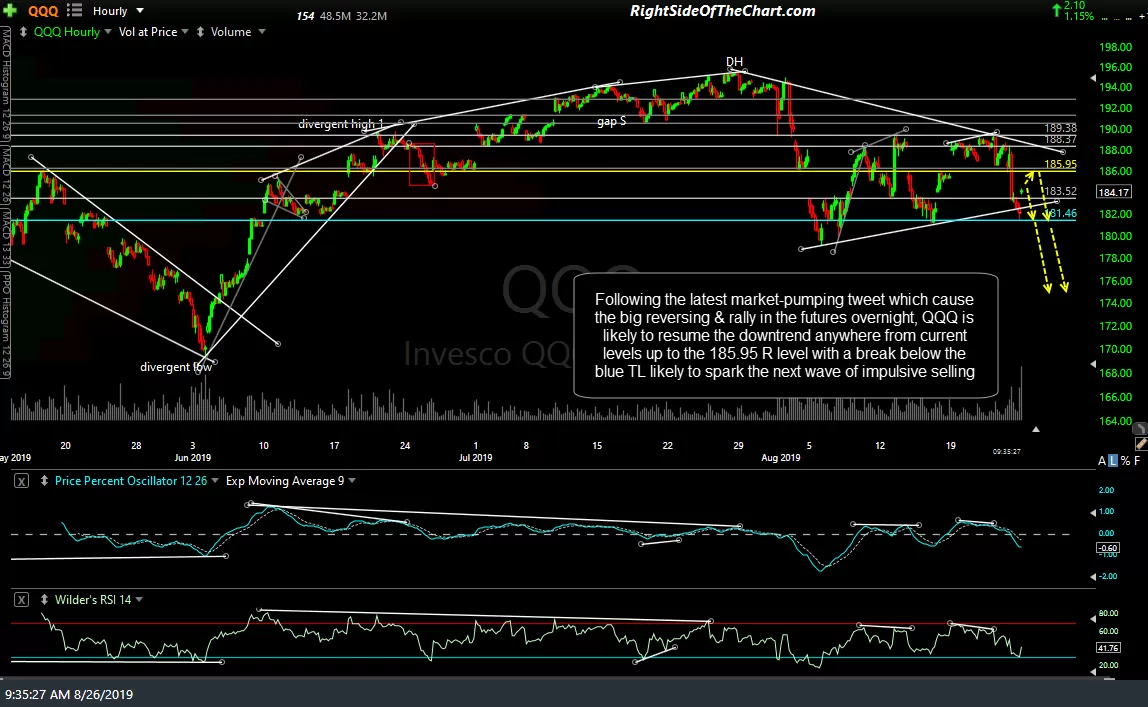
The fact that the selling following the break of those support levels was very impulsive (a vertical plunge) only helps to validate those already well-defined former support, now resistance levels. Although I favor the market reversing after the open today, should it make another thrust higher, those same levels (yellow lines) are likely to come into play as resistance & could also act as objective shorting opps. My preferred scenario, as per the pre-market post with the /NQ & /ES futures charts, is a resumption of the downtrend that completely faded today’s gap & then some. Should that pan out, I’ve listed support levels on the updated 60-minute charts below which could spark a wave of selling that would likely be even more impulsive than what we saw on Friday.
-
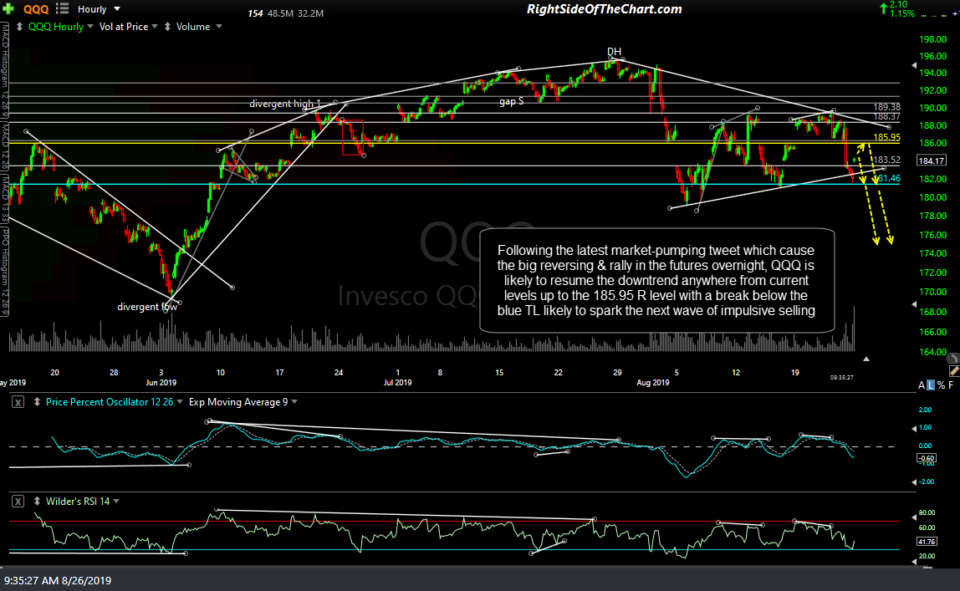
- QQQ 60-min Aug 26th
-
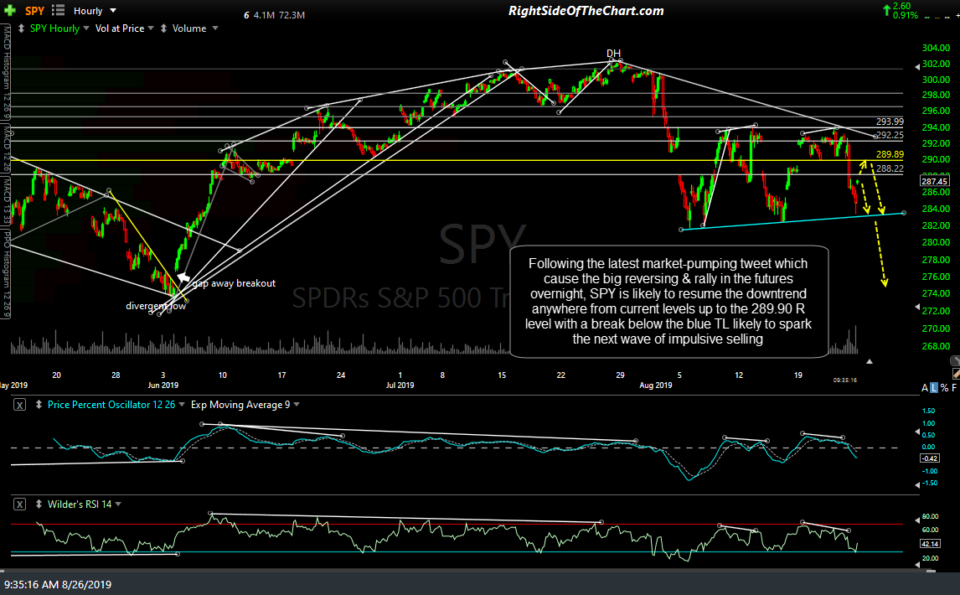
- SPY 60-min Aug 26th