
QQQ (Nasdaq 100 ETF) started to crack below this 60-minute uptrend line late in the trading session & closed below it today although we need to see some impulsive selling tomorrow to help confirm the breakdown.
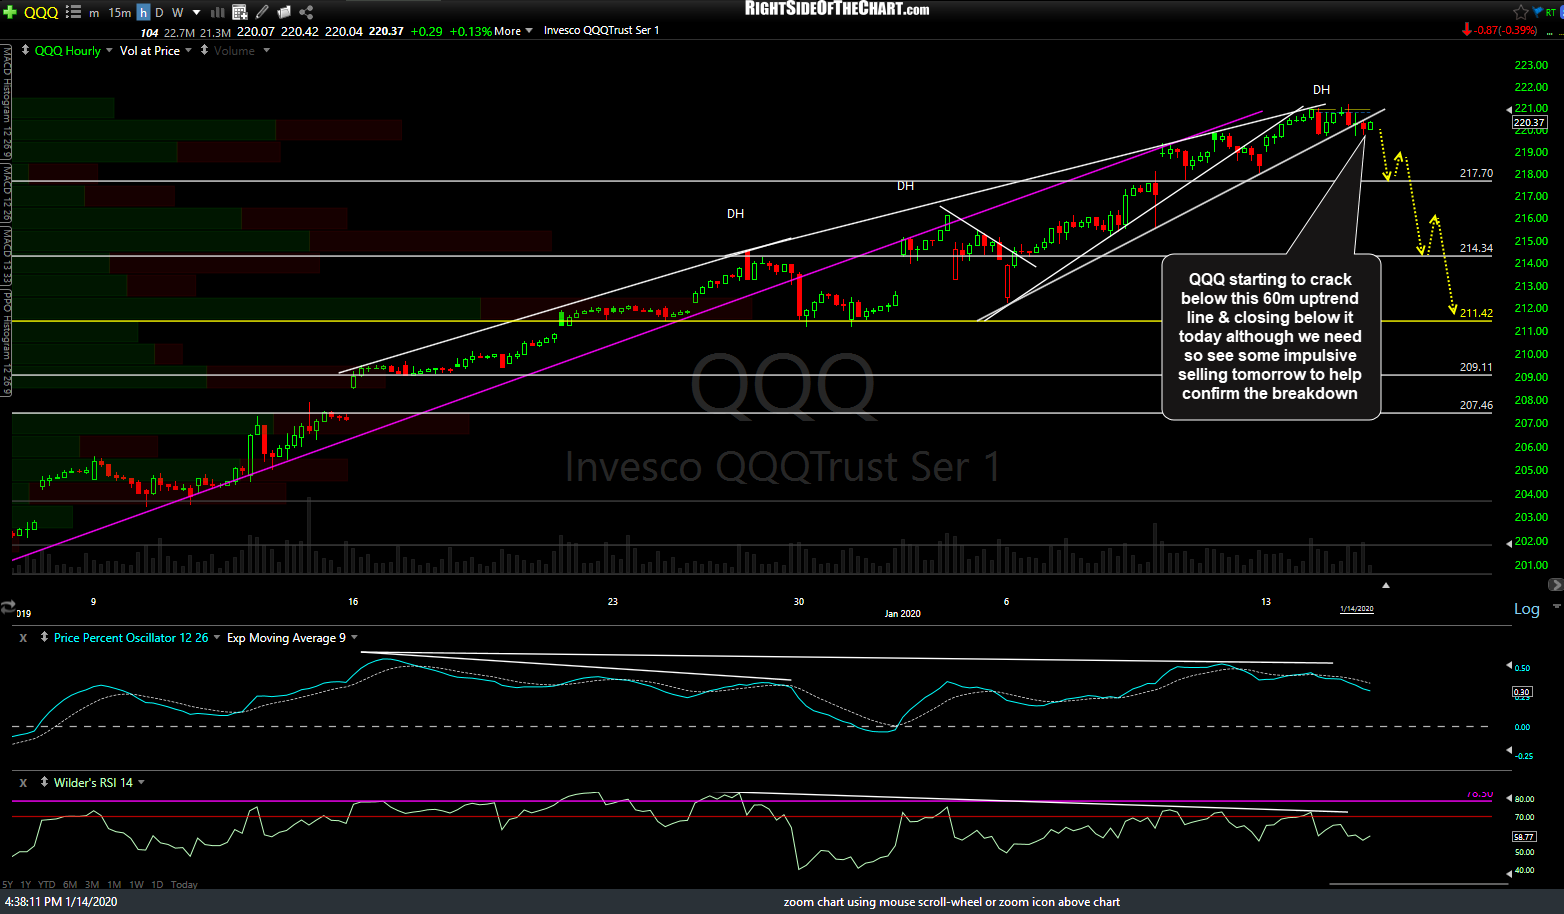
QQQ 60m Jan 14th
While the 60-minute chart above lists some near-term pullback targets, a breakdown & backtest of this 15-minute uptrend line/wedge on QQQ would trigger the next & an even better sell signal on a solid break below the 219.80 support level. Additional near-term targets on the 15m chart below.
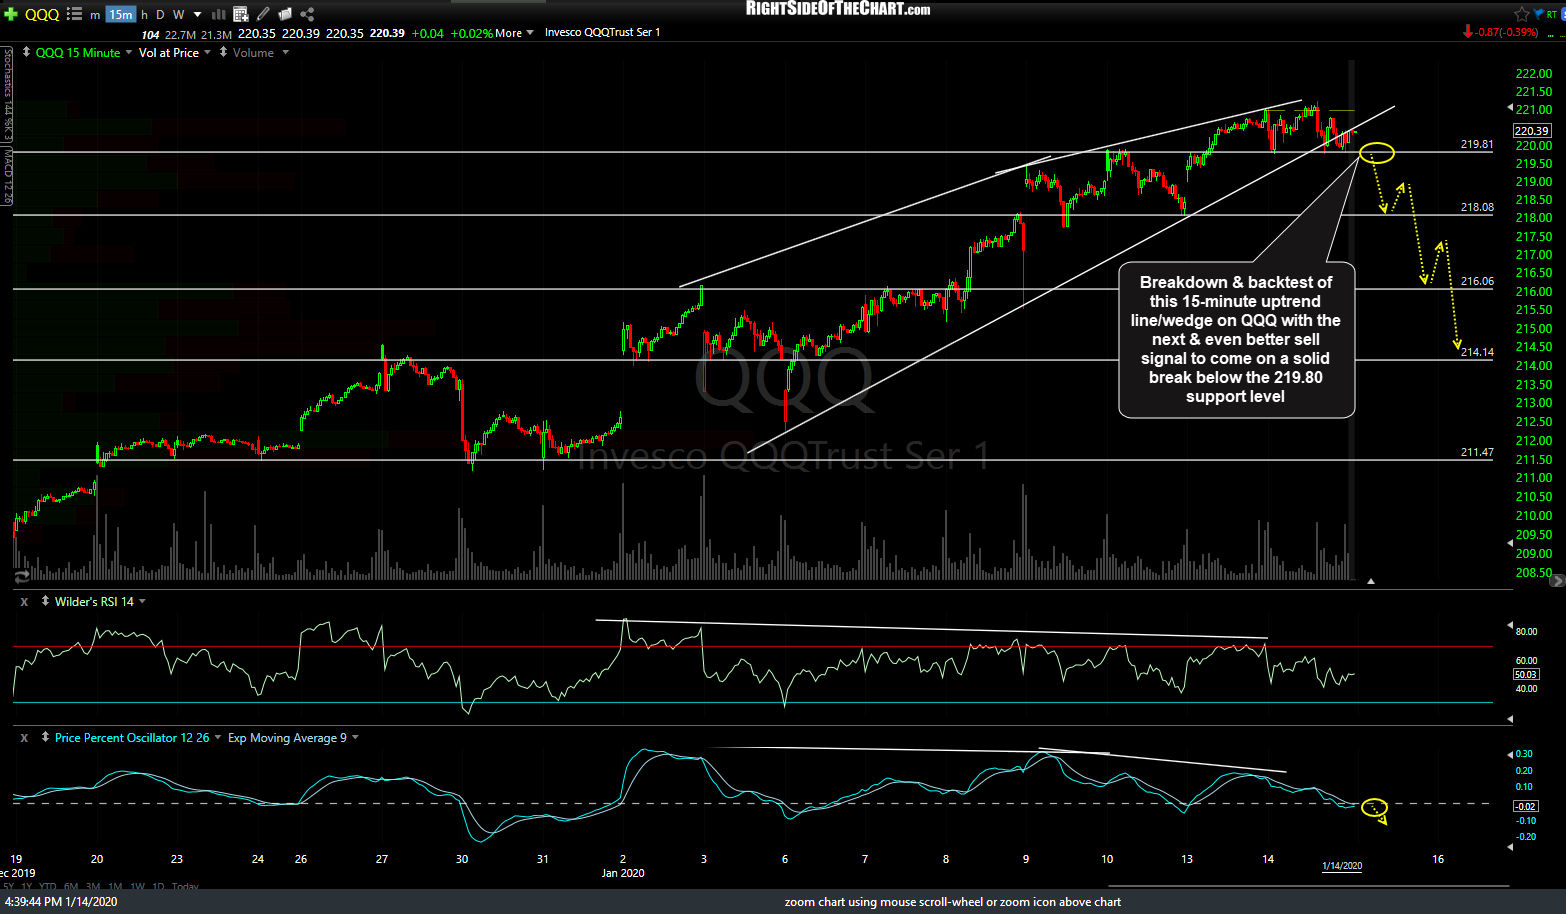
QQQ 15m 3 Jan 14th
As with QQQ, SPY made a breakdown & backtest of the upper-most trendline on the comparable 60-minute wedge late in today’s trading session with the next sell signal to come on a break below BOD/secondary trendline.

SPY 60m Jan 14th