
I just returned to my desk in time to catch these breakdowns on the 60-minute chart of both SPY & QQQ. Arrow breaks denote near-term pullback targets for active traders while the downside targets for the recent active Swing Short (daily chart, T1 already hit, T2 next stop) as well as the Long-Term (trend) Trade based on the weekly chart of QQQ.
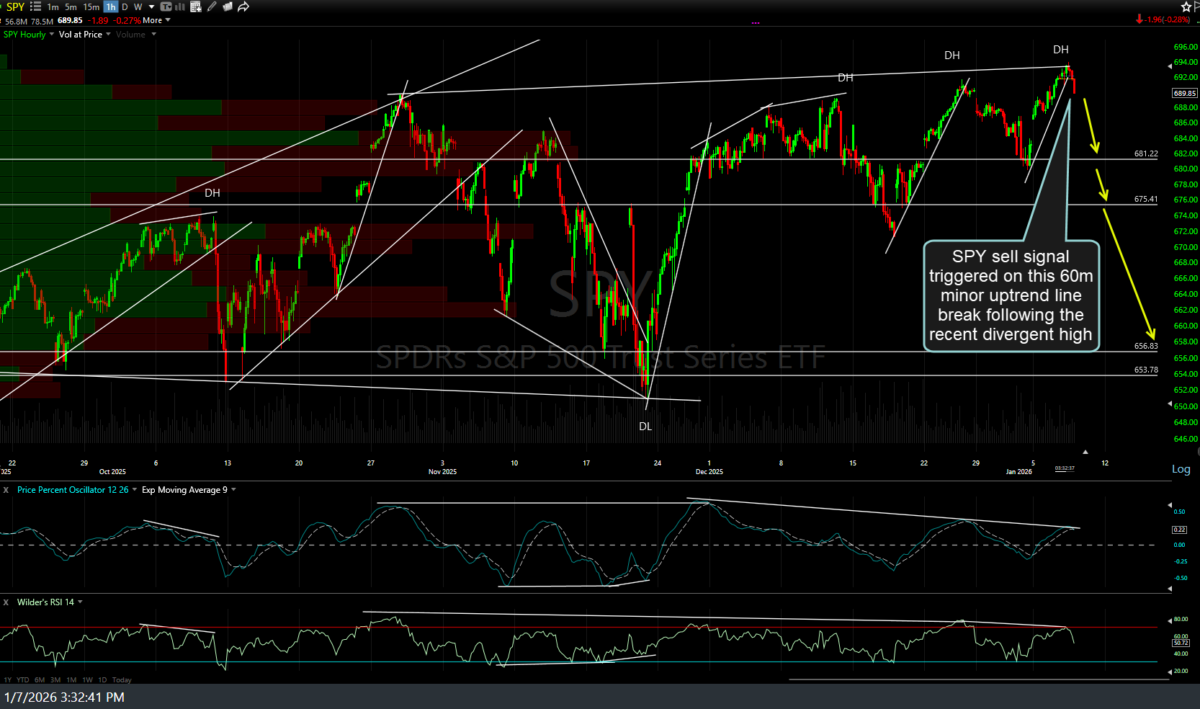
SPY 60m Jan 7th
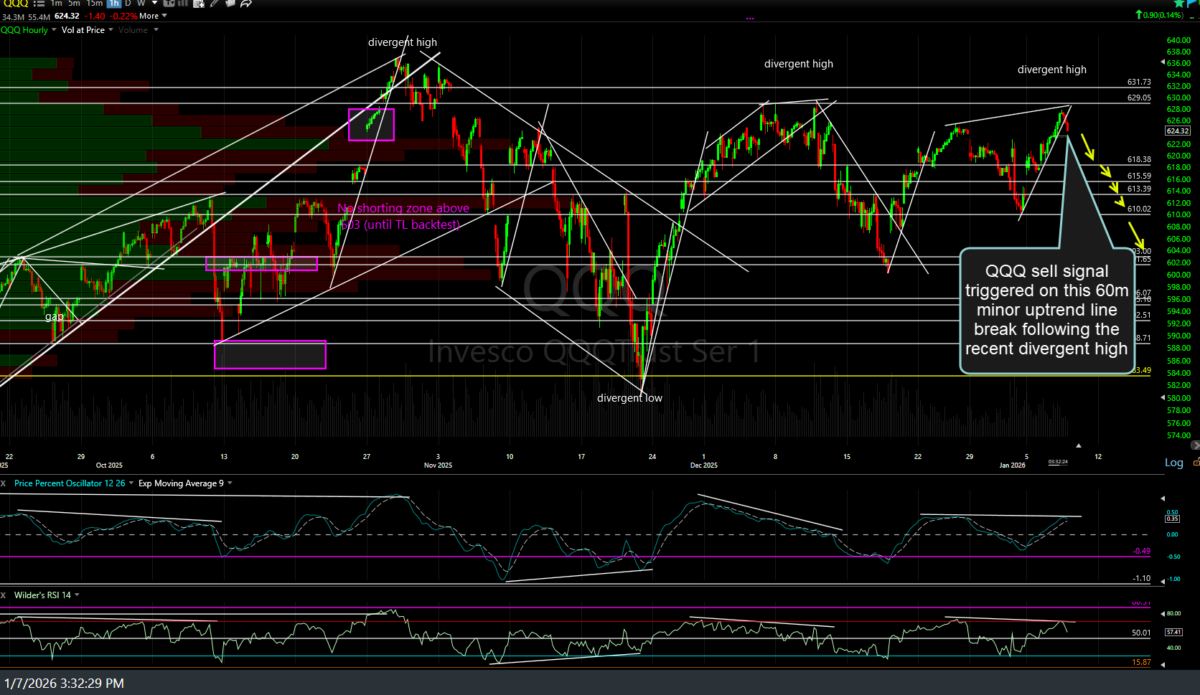
QQQ 60m Jan 7th