
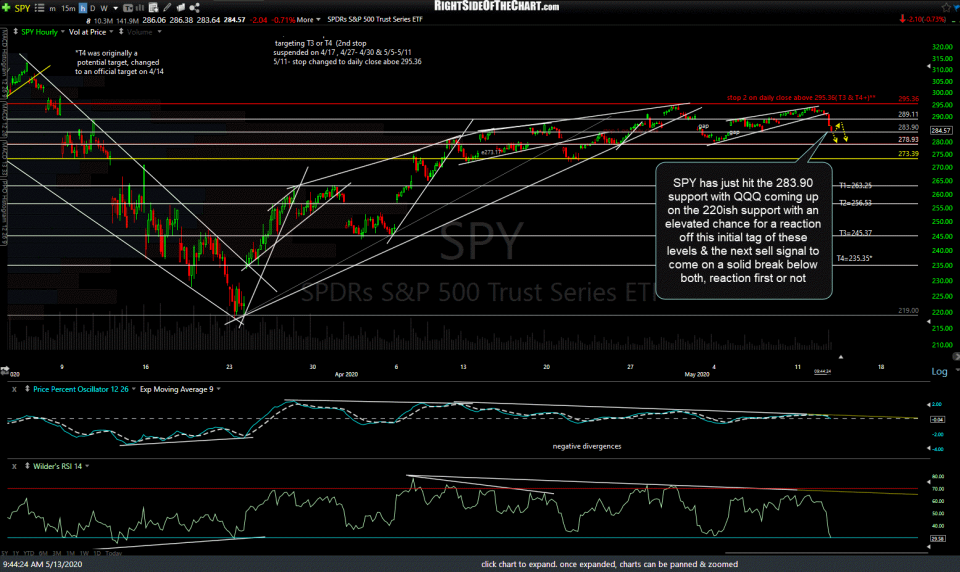
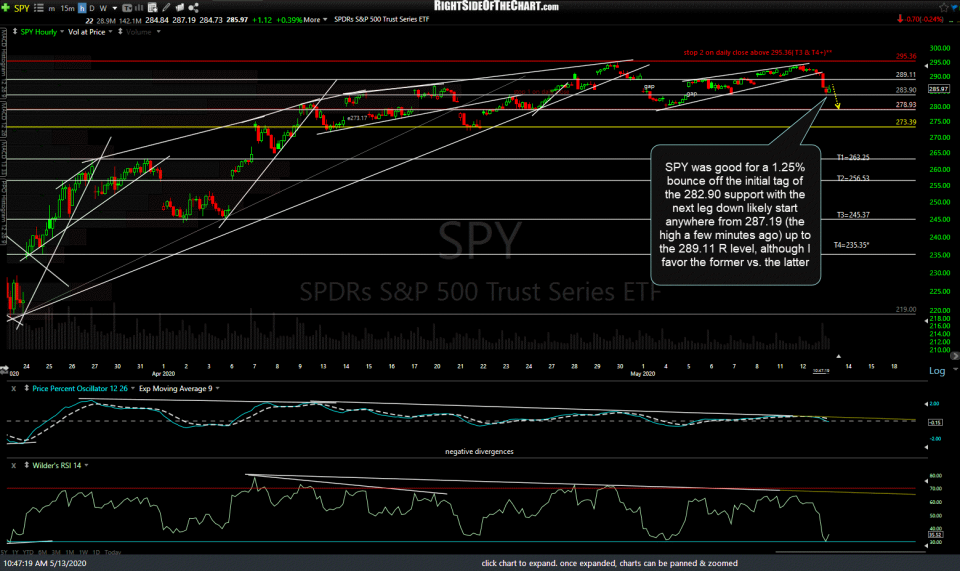
SPY was good for a 1.25% bounce off the initial tag of the 282.90 support with the next leg down likely start anywhere from 287.19 (the high a few minutes ago) up to the 289.11 R level, although I favor the former vs. the latter. Previous & updated 60-minute charts below.
-
- SPY 60m May 13th

-
- SPY 60m 2 May 13th

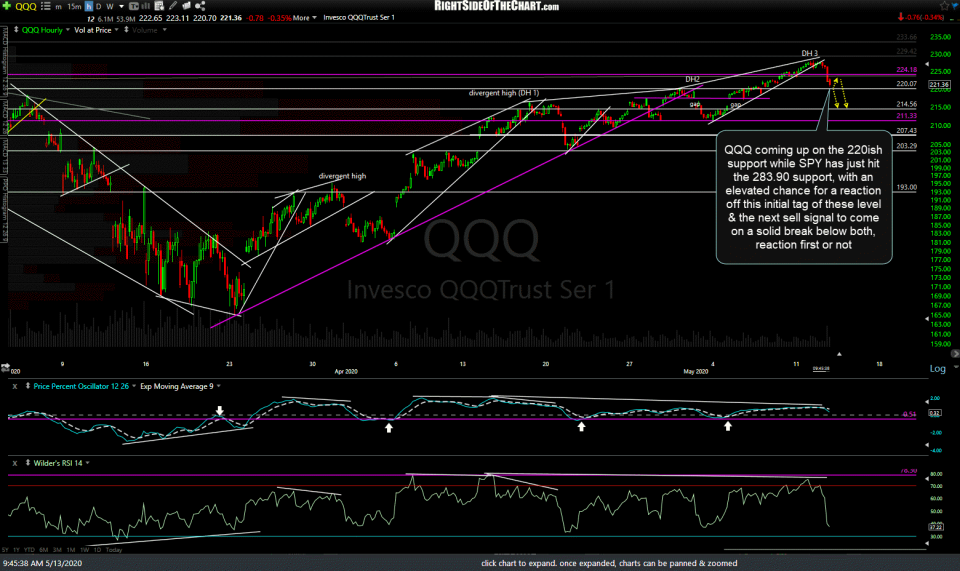
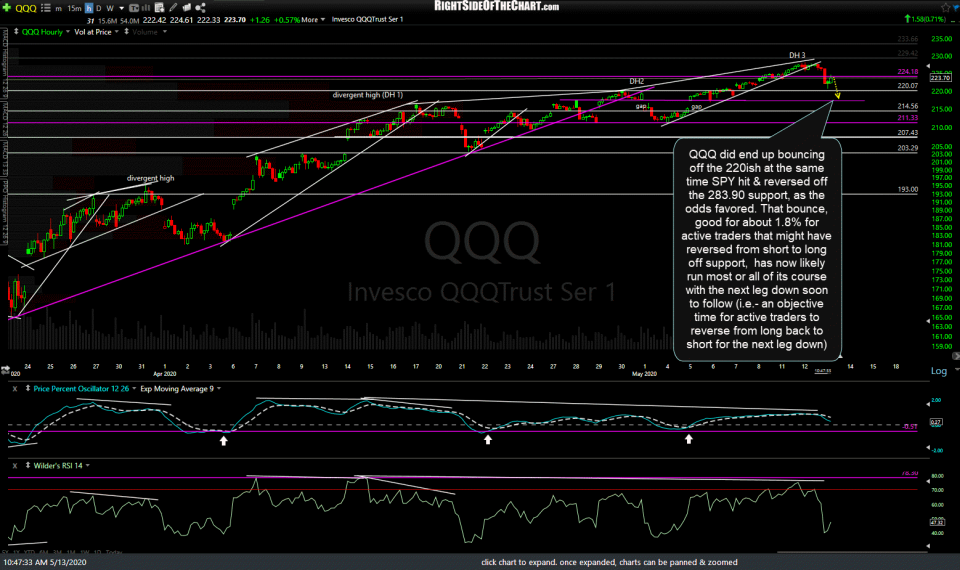
Likewise, QQQ did end up bouncing off the 220ish at the same time SPY hit & reversed off the 283.90 support, as the odds favored. That bounce, good for about 1.8% for active traders that might have reversed from short to long off support, has now likely run most or all of its course with the next leg down soon to follow (i.e.- an objective time for active traders to reverse from long back to short for the next leg down). Previous & updated 60-minute charts below.
-
- QQQ 60m May 13th

-
- QQQ 60m 2 May 13th

Regarding the stock index futures, Following the bounce off today’s early kiss of the SPY 283.90 support, /ES (S&P 500) has bounced back to the bottom of the 2869 resistance level with the even more significant 2882 resistance level just above, a likely end-point (anywhere between the two) for the expected bounce with the next leg down to 2819 likely to follow. Ditto for /NQ (Nasdaq 100) with the bounce likely to end at or just below the 9224 resistance level just above & the next leg down towards 8956.50 to come. 60-minute charts below.
-
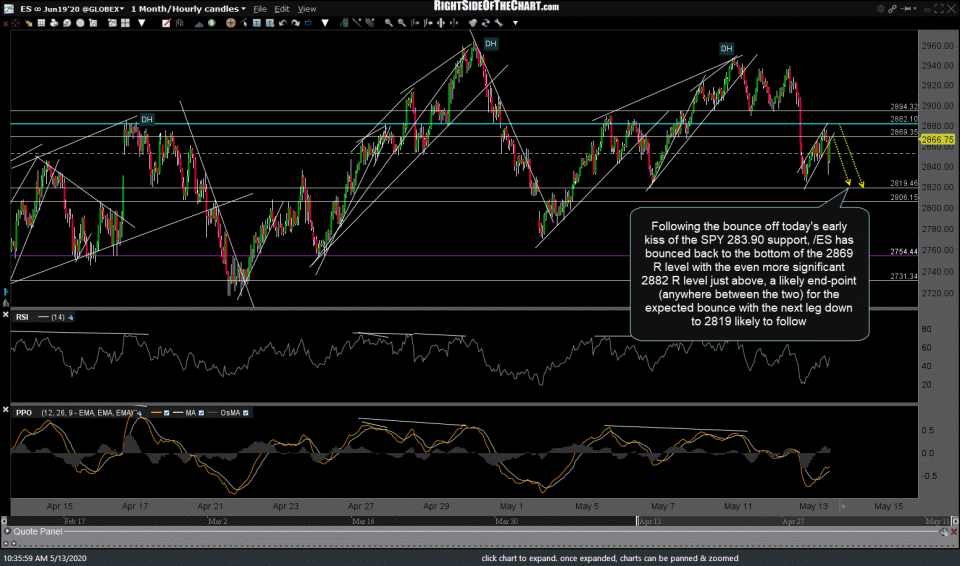
- ES 60m May 13th

-
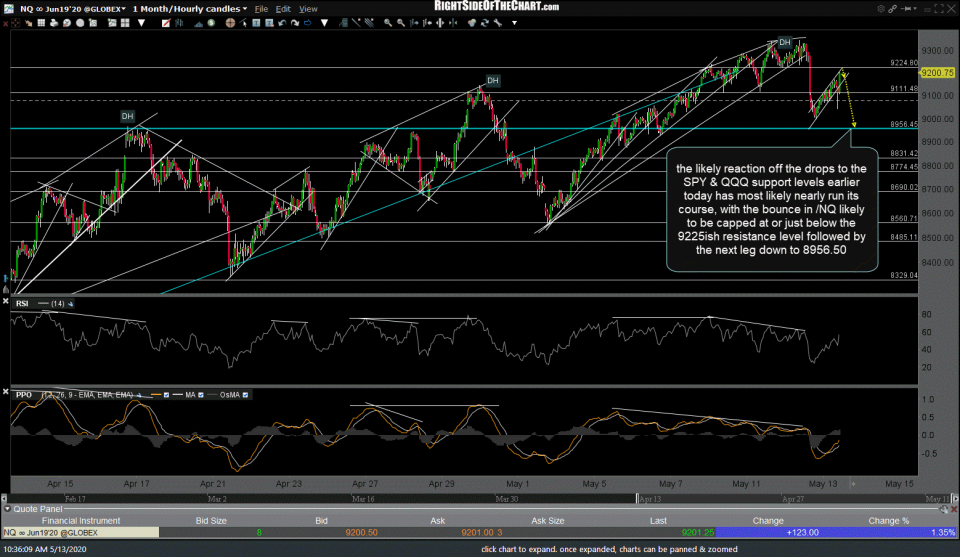
- NQ 60m May 13th

Keep in mind that once volatility expands following a period of relatively low or falling volatility, as it has following yesterday’s late-session breakdown in the indexes, things can & often do most fast. Gaming the zigs & zags of the market during corrections is best left to active, nimble, & experienced traders will more typical swing traders might opt to sit tight & stick with their trading plan, riding out any counter-trend rallies or corrections along the way (whether long or short).
The same support levels on the charts above can be used as entry points for those that believe the uptrend off the March 23rd lows has plenty of room left to run while those expecting more downside from here could use those levels as strategic entry points for managing short positions (i.e.- cover on the dips to support; short or add to shorts on bounces back up to resistance and/or set stops somewhat above the key resistance levels.
Bigger picture (or at least intermediate-term); The broad market is still well within the multi-week trading range with a solid break below the range (SPY 273.39ish) bearish or above it (SPY 295ish) bullish. As of now, I continue to favor the former vs. the latter. Although the day is still young & anything can happen by the close today, so far we have confirmation to yesterday’s bearish engulfing candlesticks via additional downside although as I like to say, The redder the better, so let’s see what the rest of today & tomorrow brings.