
The sell signals highlighted in this morning’s video (which were pending at the time) were triggered on the impulsive break & close below both uptrend lines on the QQQ & SPY 60-min charts today with potential bear flag continuation patterns formed into the close on both. The measured target of the flag pattern, should we get another sell signal on a break below the flag after the open tomorrow, would take QQQ down to the first target zone (300.41-297.74).
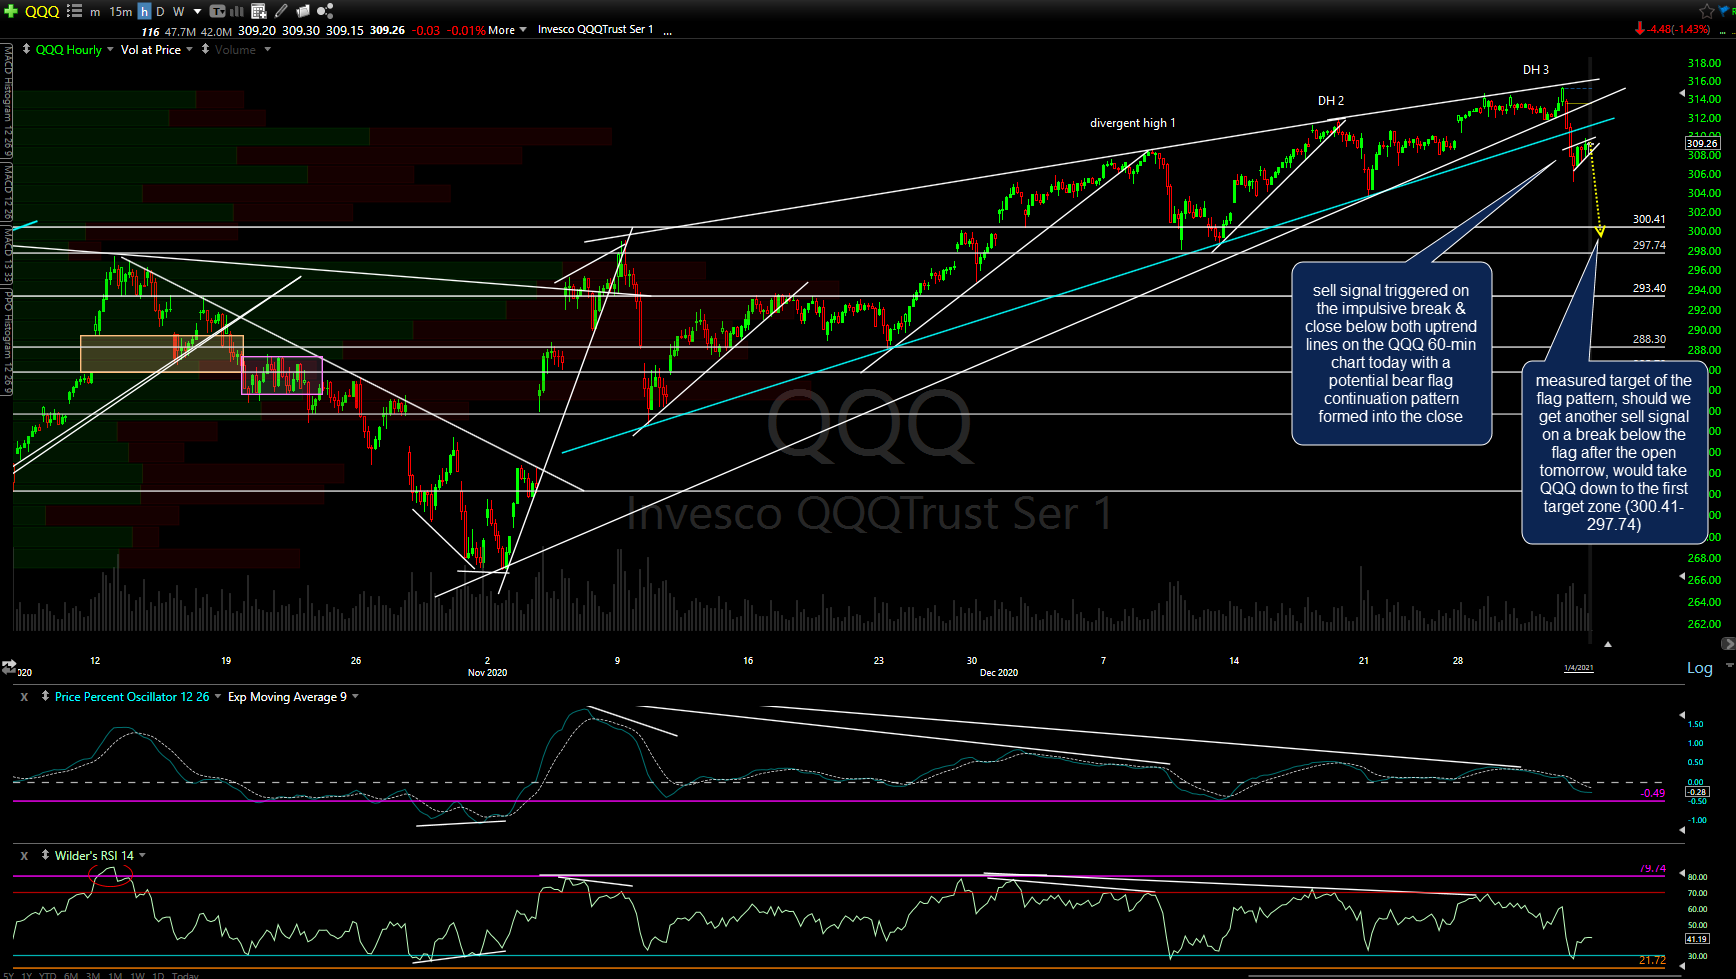
QQQ 60m 2 Jan 4th
Zooming out to the daily time frames, I’ll be on watch for a red candle tomorrow, ideally closing below today’s lows, to confirm today’s bearish engulfing candlesticks on both SPY & QQQ as potential trend reversal sticks. Should we get one or more confirming red candlesticks in the coming trading sessions, the marked support levels below would be potential price targets for a swing short on the index ETFs.
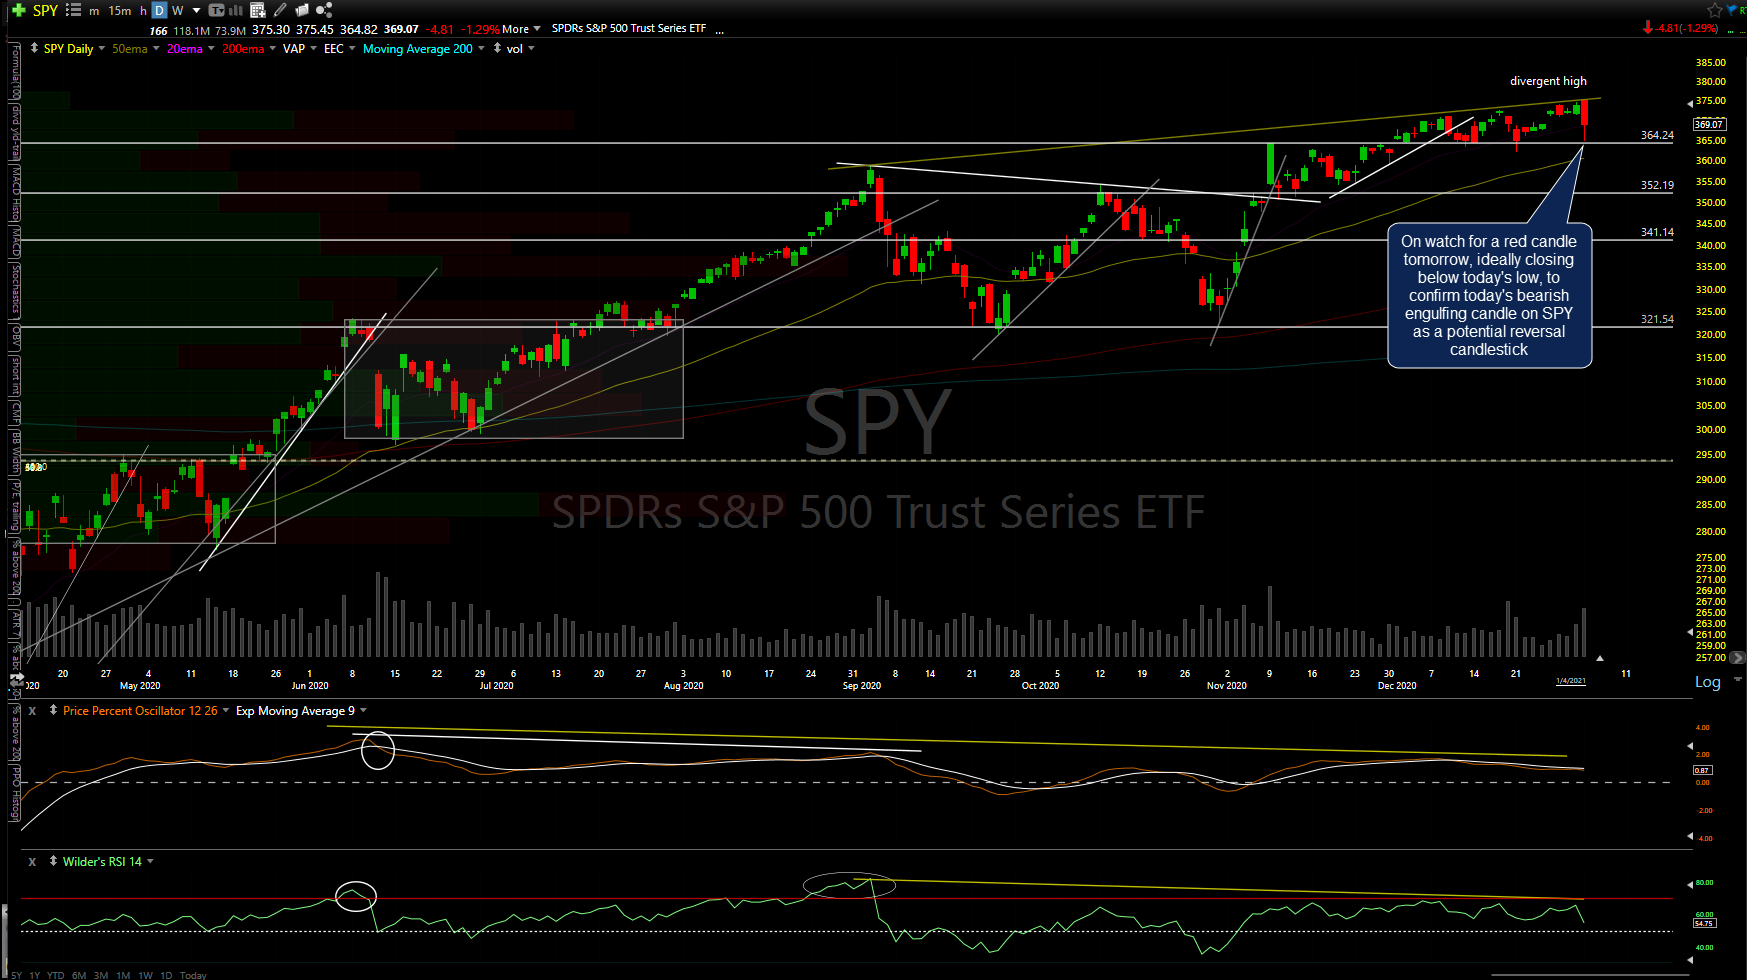
SPY daily Jan 4th
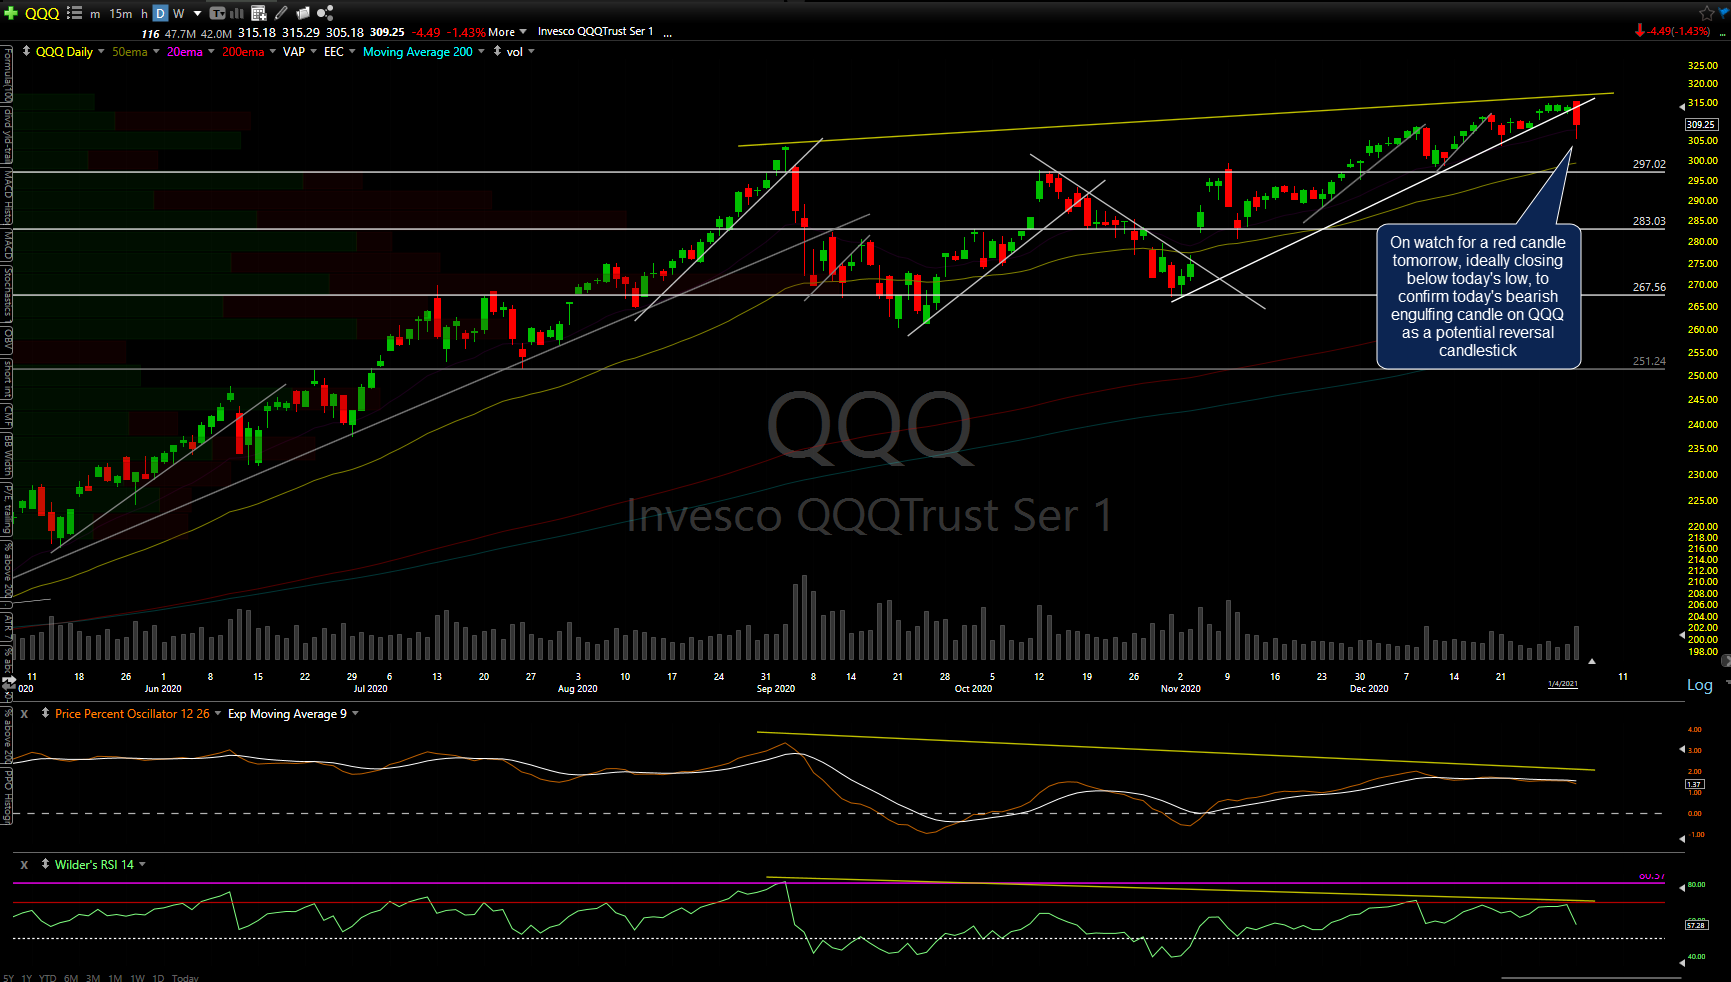
QQQ daily Jan 4th
On a related note, both Treasuries & the US Dollar were mostly flat today & neither have confirmed the breakdown in the stock indices as of yet. That, coupled with the resiliency of the recent uptrend & increased chance of whipsaw signals around the holidays, makes it prudent to wait to & see if those bearish engulfing candles are confirmed with more downside before going to a full short position on the indexes.