
QQQ successfully tested & bounced off the 9/6 previous low & is currently testing the uptrend line from below with potentially strong but unconfirmed positive divergences on the indicators. Sell signal still pending a solid break below those recent & now today’s lows (BOD support) & especially a “negation” of the divergences with a new lower low on the indicators. 60-minute chart below.
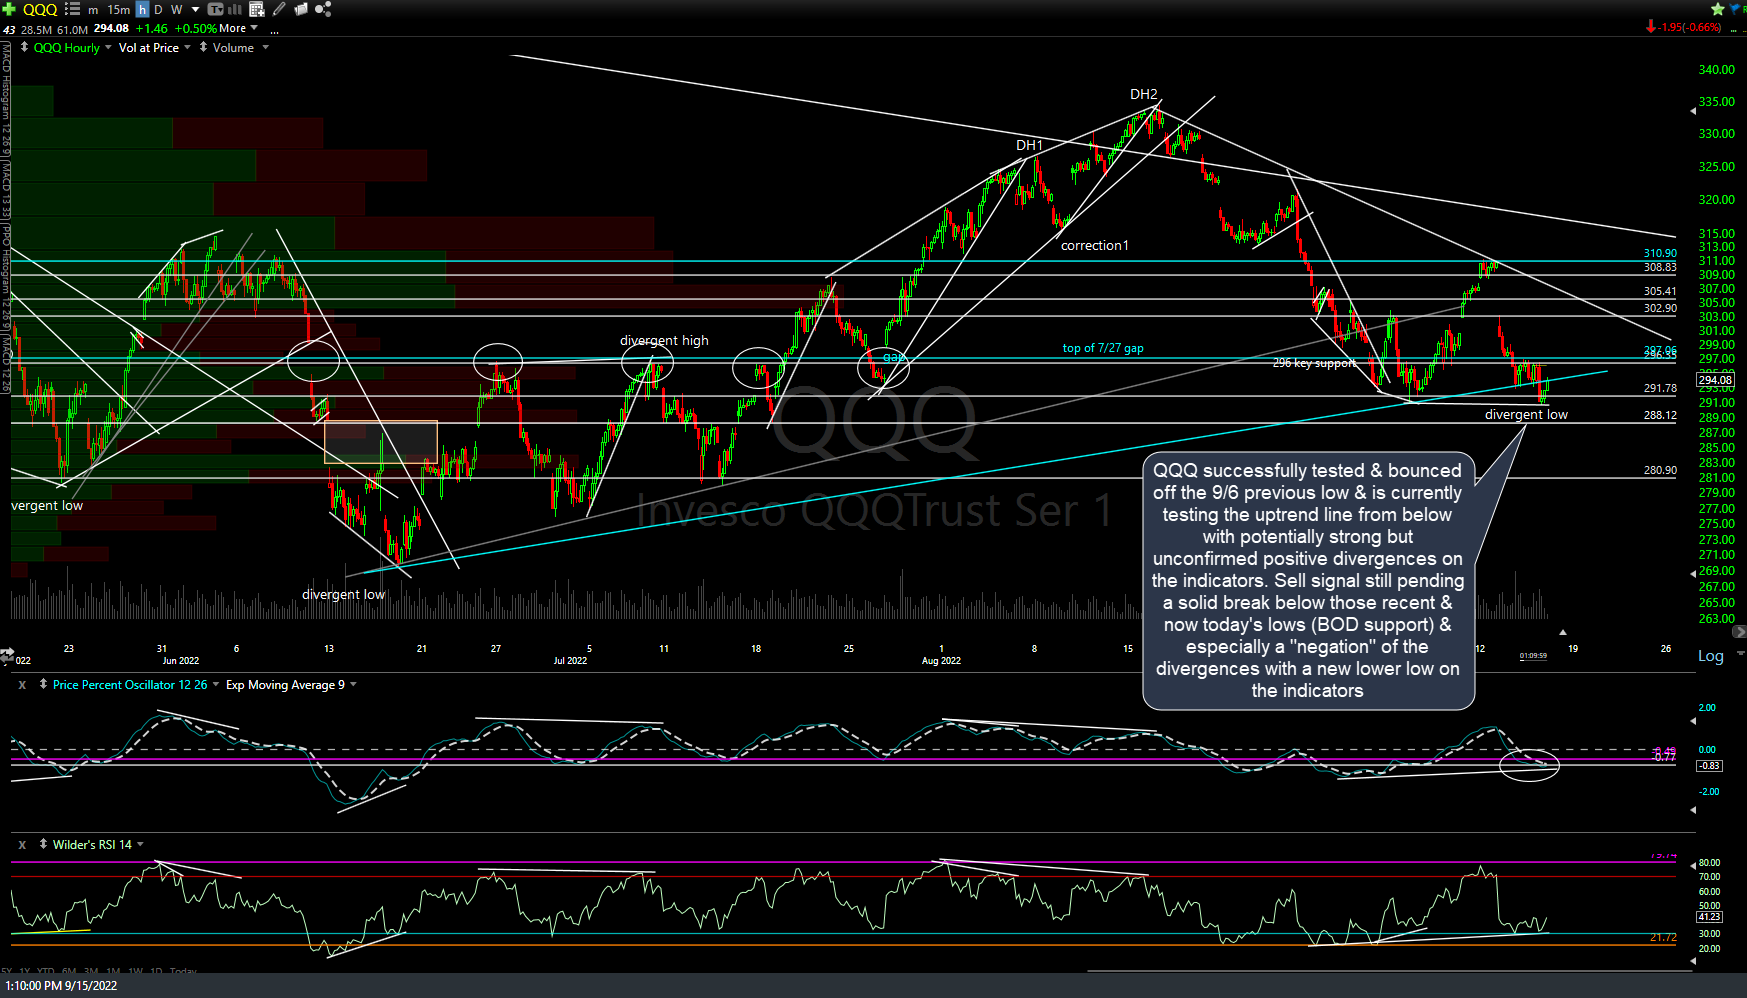
QQQ 60m Sept 15th
/NQ (Nasdaq 100 futures) briefly dipped below the uptrend line off the June lows but successfully tested & is holding above the previous lows, my BOD, or ‘benefit of the doubt’ support level), with strong, but still unconfirmed, positive divergences building on the indicators. 60-minute chart below.
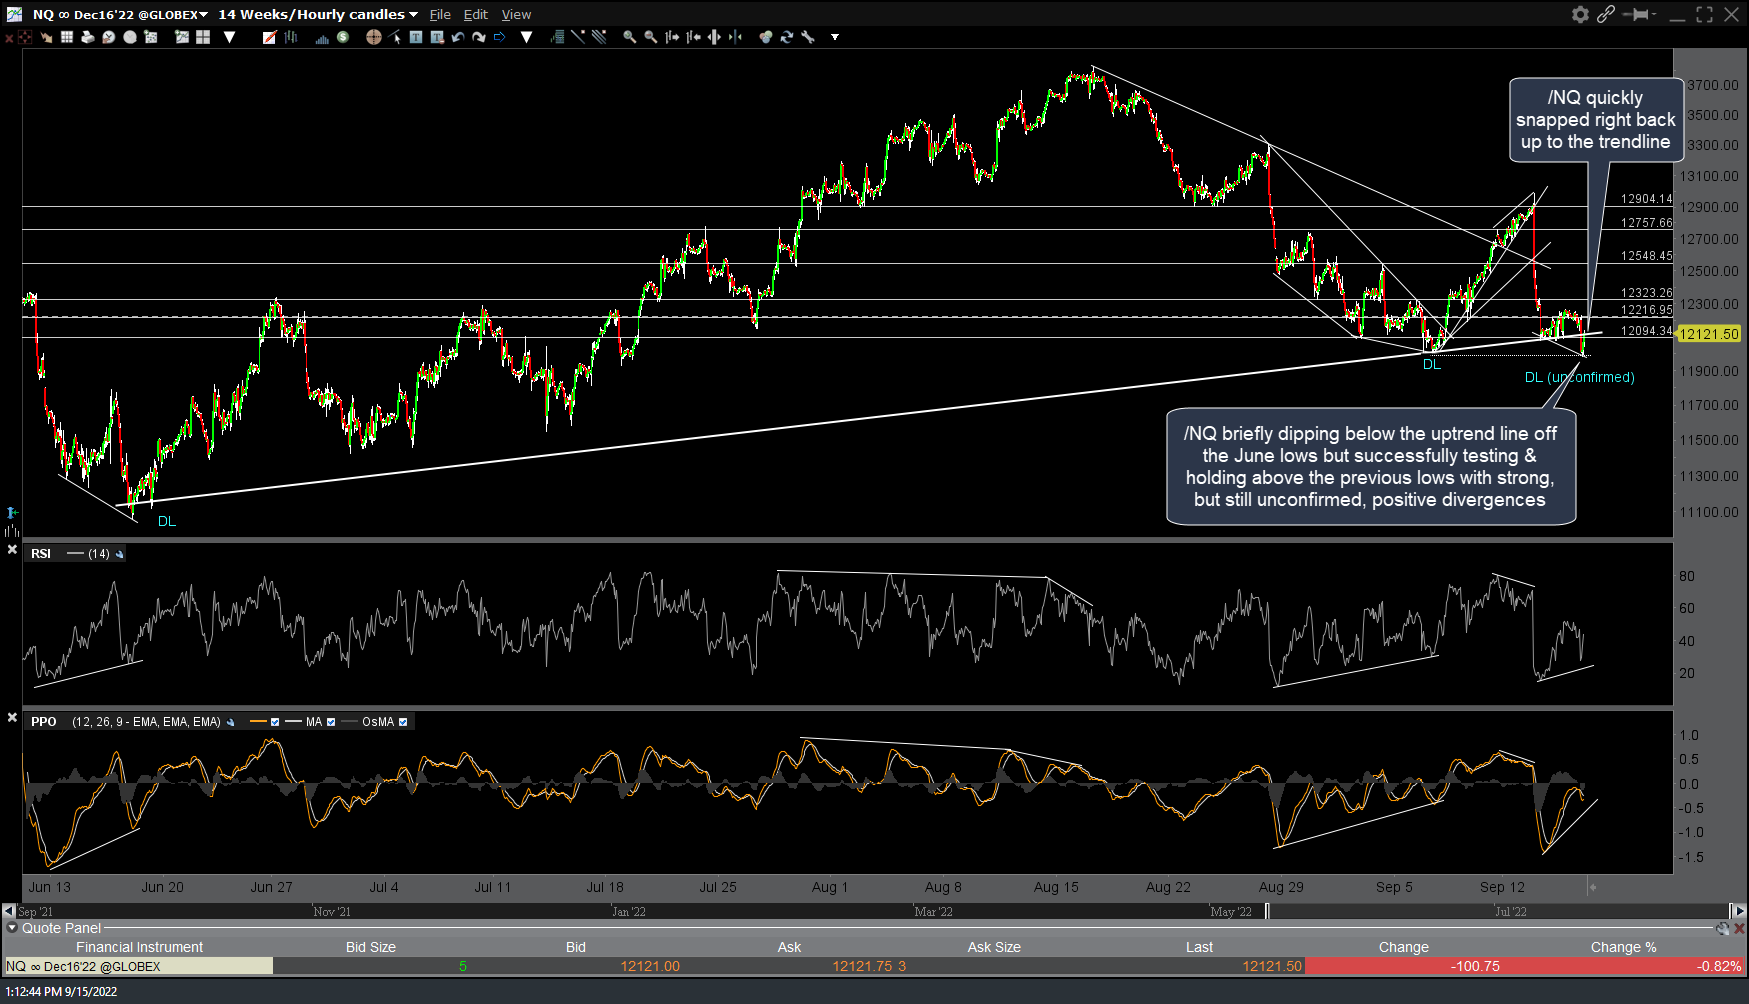
NQ 60m Sept 15th
Likewise, we just had another successful test of the recent lows as SPY continues hold above the primary uptrend line as well. 60-minute chart below.
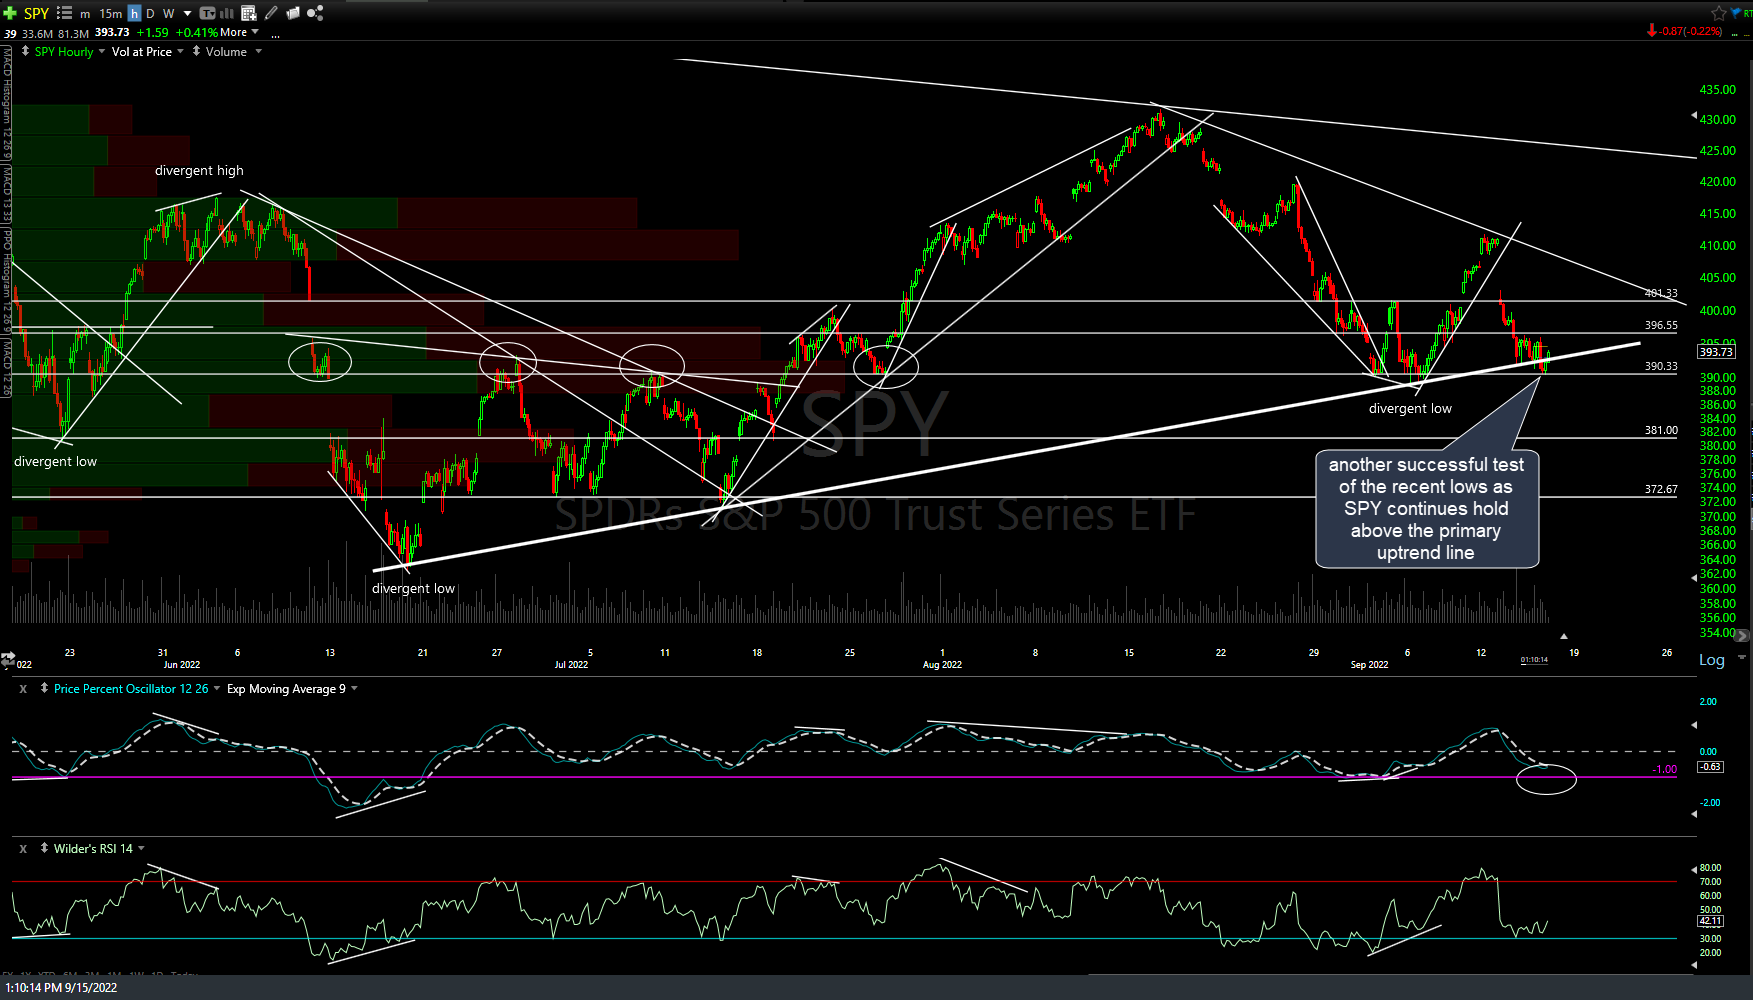
SPY 60m Sept 15th
/ES (S&P 500 futures) briefly dipped below its comparable uptrend line as well but also still holding above the previous lows with potentially strong, but unconfirmed, positive divergences. Next sell signal still pending a solid break below the 9/6 previous low. 60-minute chart below.
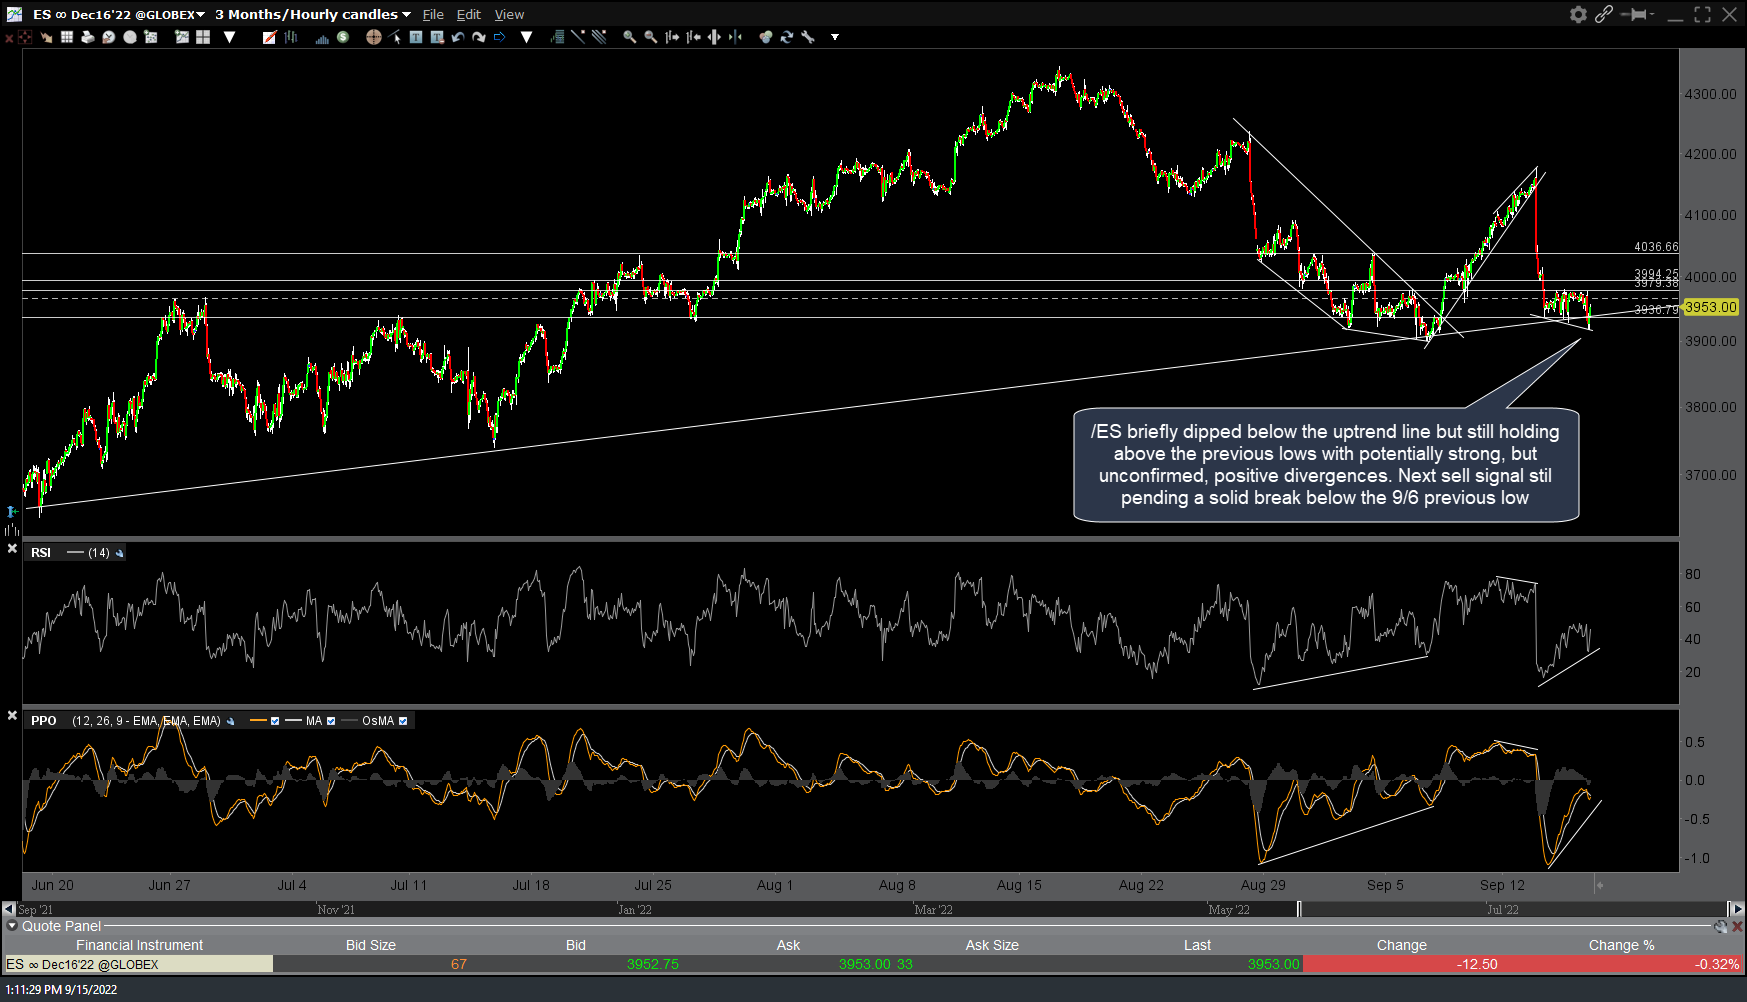
ES 60m Sept 15th
Bottom line: The major stock indexes continue to remain just above very key support after successfully testing the low-end range of that support today. Additionally, both the S&P 500 and the Nasdaq have very strong, but unconfirmed positive (bullish) divergences as prices make lower lows against the momentum indicators making higher lows. I’ve pointed out all the divergent lows on the 60-minute charts since the bear market started late last year (Nasdaq) and at the start of this year (S&P 500) and most, if not all of those divergent lows were followed by substantial rallies, including the two big ones (17% & 24%) in QQQ.
While normally I’d be covering my swing shorts & moving into longs based on the fact the major indexes are at well-defined support with strong divergences on the indicators, and very well may do that soon (depending on what I see going forward), as of now I’m sitting tight on my swing short positions as I suspect this seemingly uber-bullish setup will fail to play out as those previous divergent lows & drops to support did.
Maybe, maybe not & that’s why it is critical to adjust/adapt if & when the technical evidence to do so begins to mount. Despite the aforementioned bullish developments, which should definitely be monitored for further development, should they fail to play out with the major stock indices going on to make solid breakdowns & closes below the recent (and now, today’s) lows, especially if the divergences are “negated” via lower lows in the indicators, that would be quite bearish as the failure of clearly bullish technical patterns are usually followed by a powerful wave of selling as longs scramble to unwind their position & shorts piling in as they smell the blood in the water. Vice versa if the bulls can successfully defend these key supports (or ramp the indexes back above if we get just a brief dip below followed by a reversal), as that would likely spark a short-covering rally.