
Nov 15th: “Should IWM break out, the first targets & likely stopping points for any rally would be 147.43 then 148.37 (first two horizontal lines overhead).” Yesterday, IWM hits a high of 148.40 before reversing into the close. Should yesterday’s highs not prove to be the end point for the bullish falling wedge rally, the resistance levels (besides 148.37-138.40) are a resistance zone at 149.14-149.42 followed by the previous highs at 150.68. My confidence on which scenario plays out isn’t high as yesterday’s rally flipped the 60-minute trend indicators from bearish to bullish on IWM as well as QQQ & one of two trend indicators on SPY.
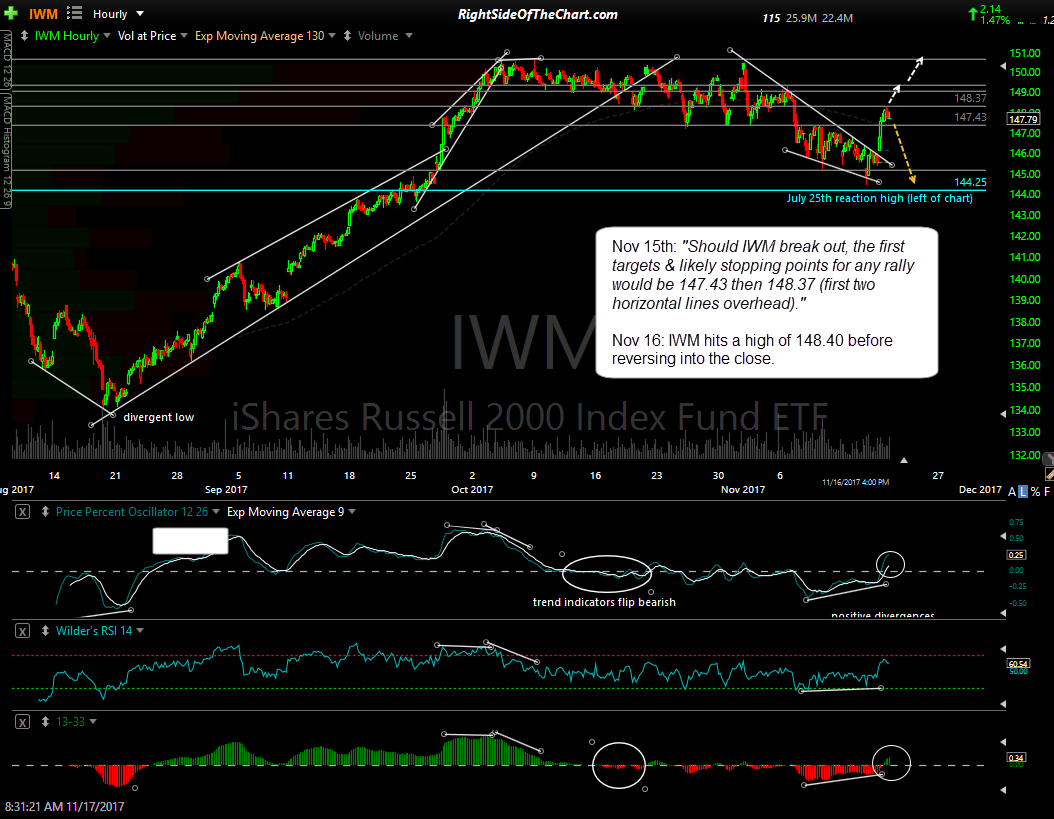
IWM 60-min Nov 16th close
QQQ closed exactly on the Nov 8th high of 154.54 & a new closing high of 4 cents above the previous all-time closing high to extend the current negative divergences that have been building on the 60-min chart. As the dotted blue lines show, any near-term gains in QQQ will still keep the divergences intact.
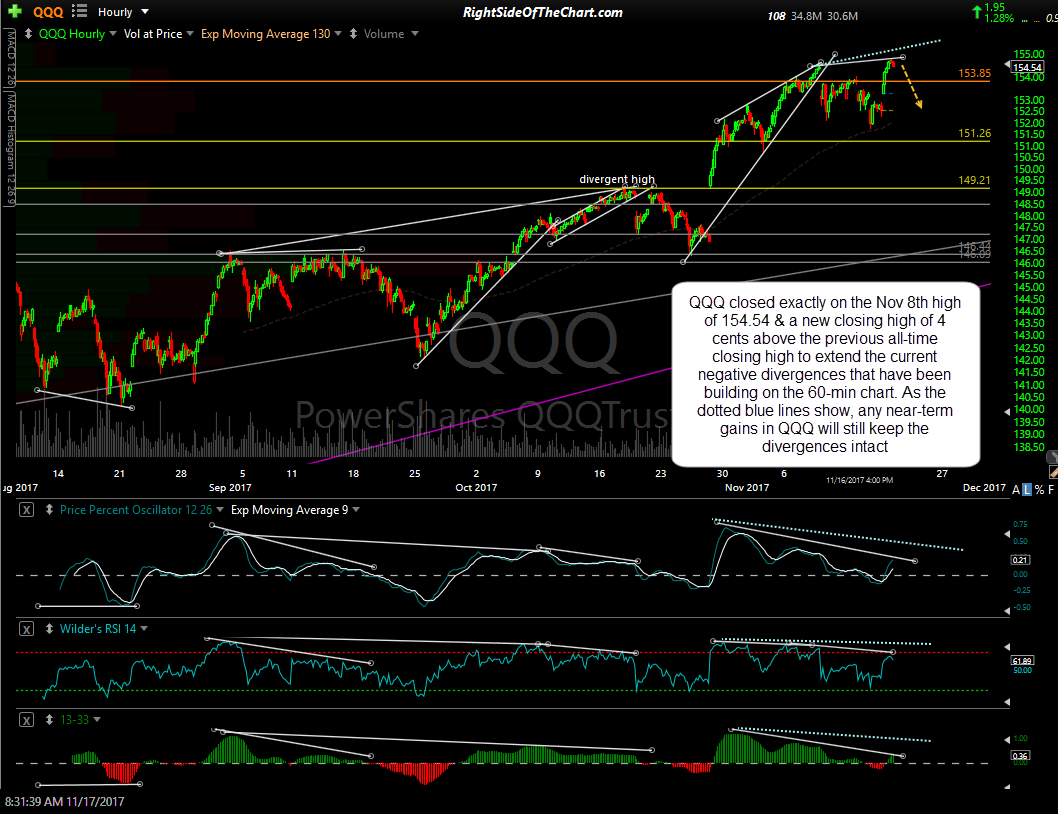
QQQ Nov 17th close
SPY reversed after backfilling the Nov 8/9 gap with a backtest of the uptrend line about 0.36% above where SPY closed yesterday. Note that the 13/33-ema histogram, which defined the trend as bearish when below the zero line, bullish when above, crossed back & closed above zero yesterday. The PPO signal line (9-ema) also helps define the 60-minute trend when above or below zero & close about on the zero line yesterday. As such, any upside & green close today would put both trend indicators on a buy signal while a red close or any significant downside during the trading session could indicate that yesterday’s rally was simply a counter-trend rally in a new downtrend triggered a whipsaw signal that started on Nov. 9th when SPY broke down below the uptrend line with both trend indicators confirming via bearish crosses below their respective zero lines.

SPY 60-min Nov 16th close