
We have negative divergences below this steep bearish rising wedge on the 60-minute chart of /ES (S&P 500 futures) with a sell signal to come on a solid break below. Minimum target 3460.50, 2nd potential target uptrend line & a 3rd potential target of 3417.
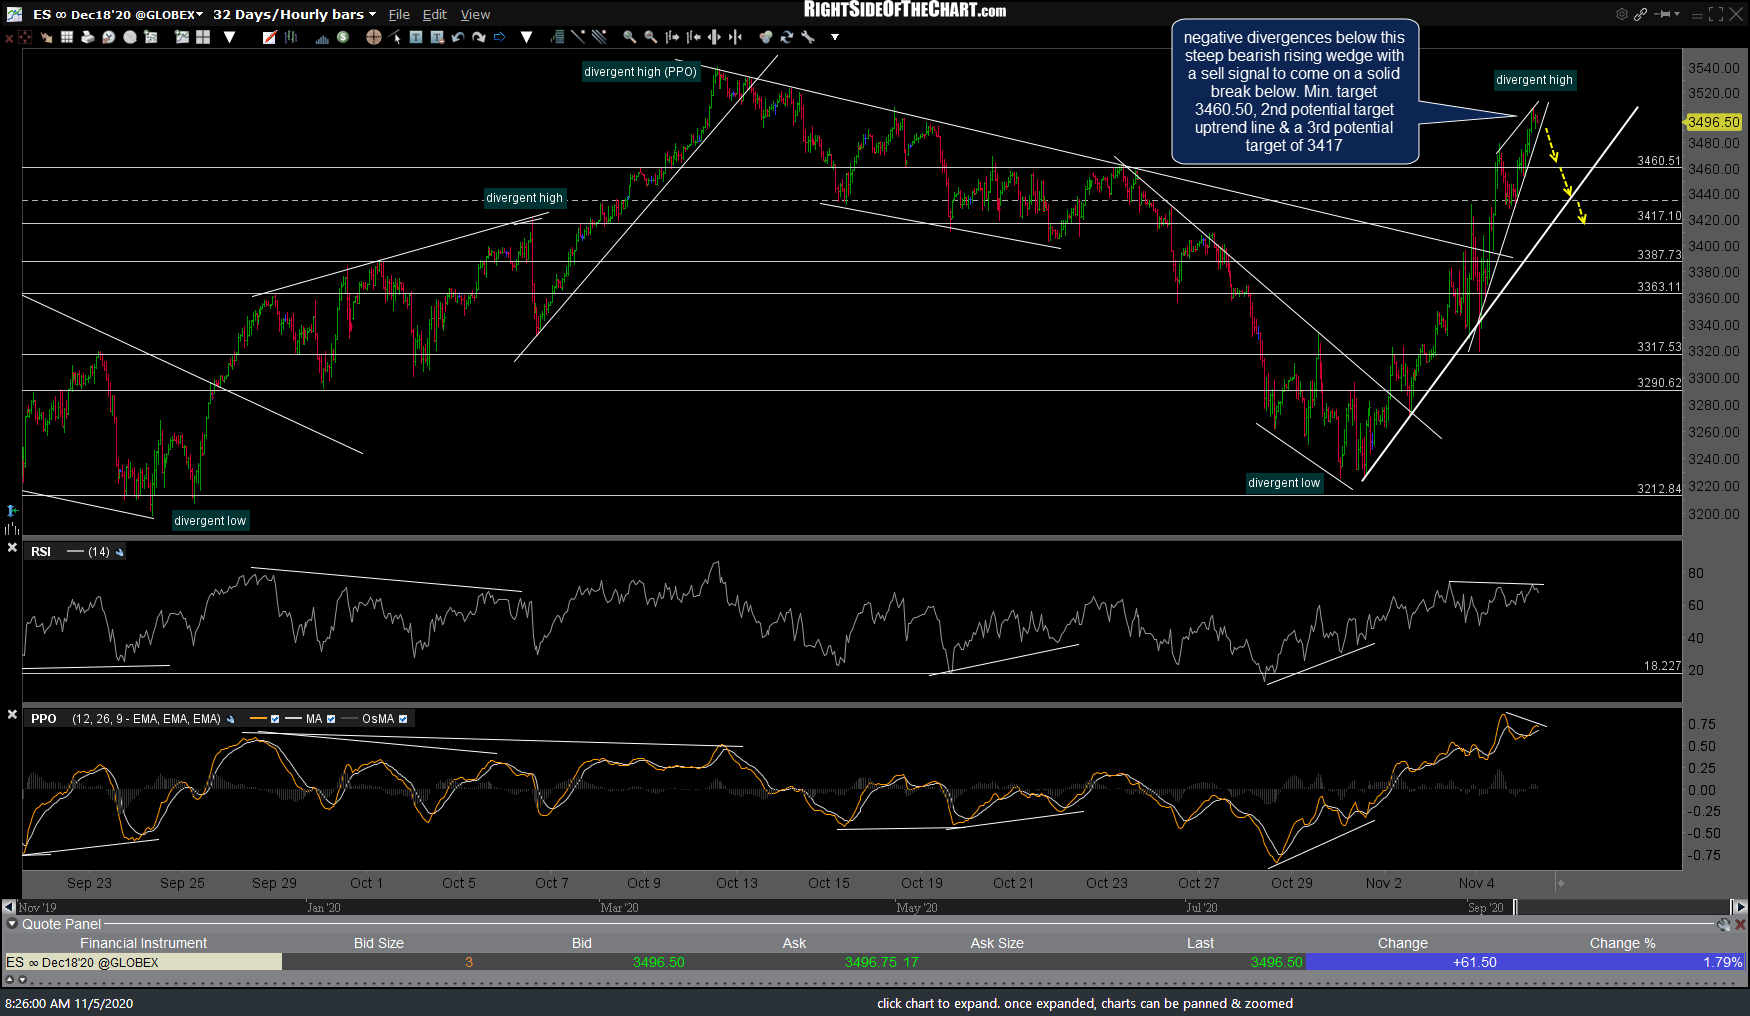
ES 60m Nov 5th
Ignore this big errant pre-market candle although the bottom of it does align with a potential pullback target (bottom of today’s gap) on SPY with a pullback target zone 343.50-342.37.
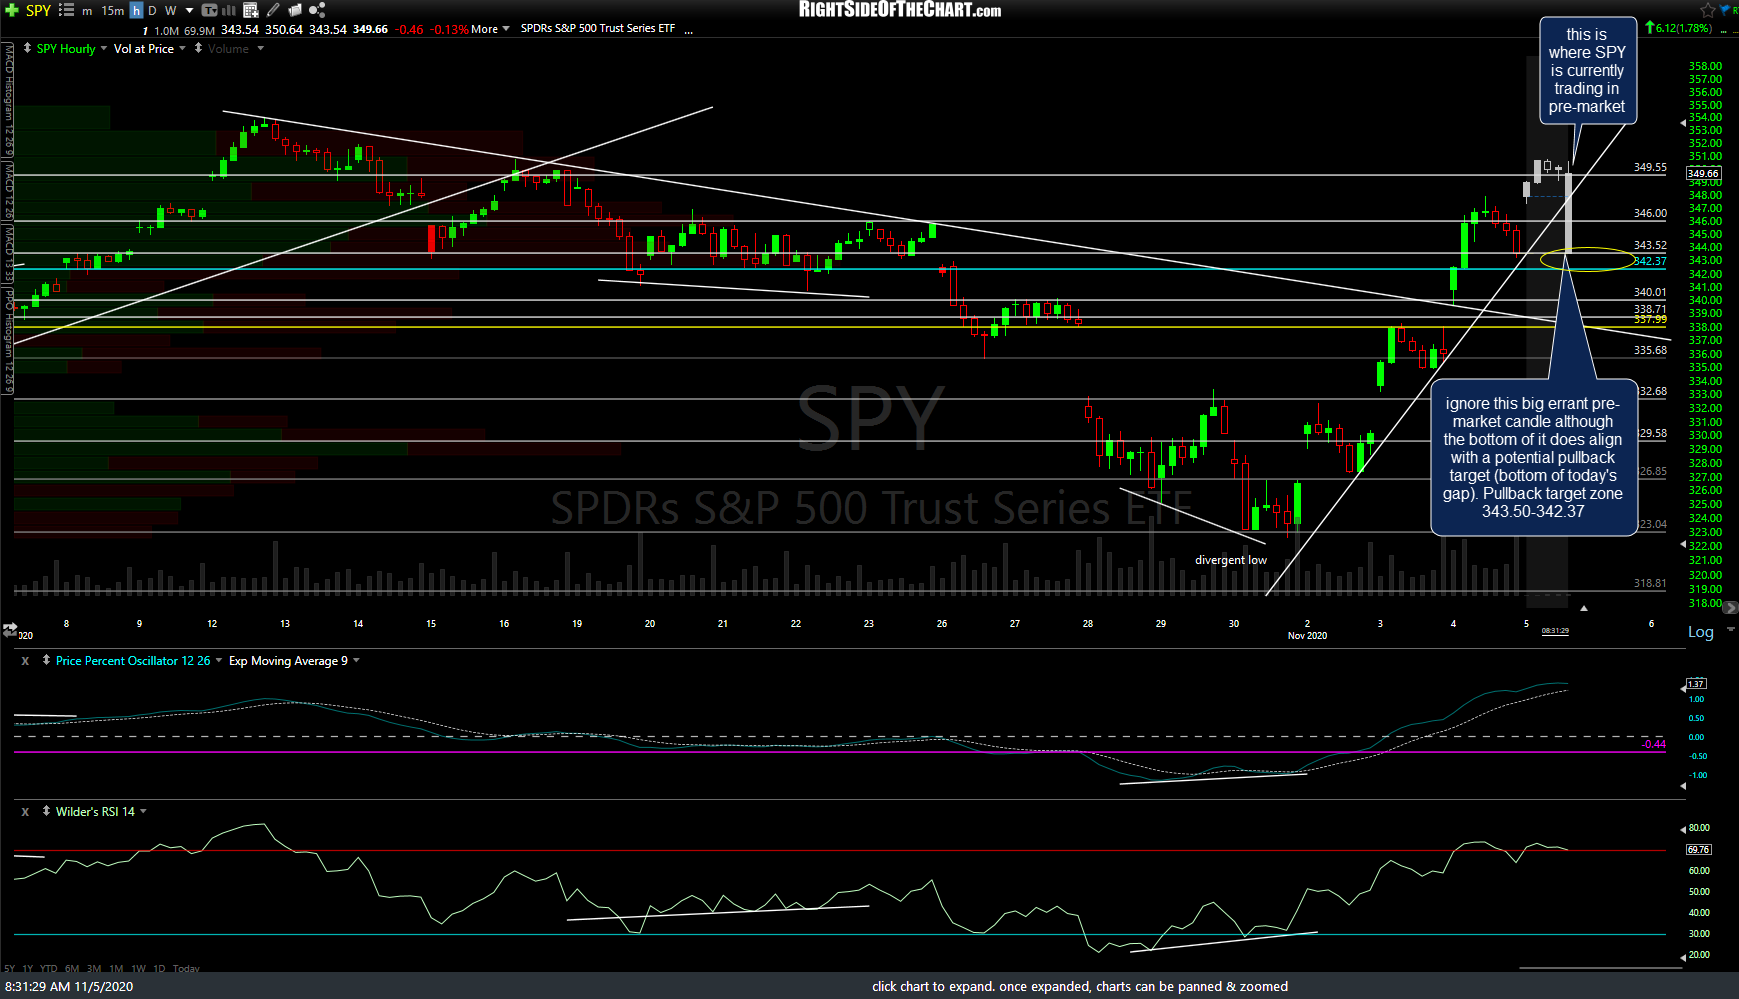
SPY 60m Nov 5th
On the /NQ (Nasdaq 100) 60-minute chart we have a potential momo-fueled overshoot of the 12031 resistance level with a sell signal to come on a solid break back below it as well as the minor (first) uptrend line. Although 11945 is the first minor support where we might get a reaction, my preferred pullback target is the primary uptrend line + 11787 support level.
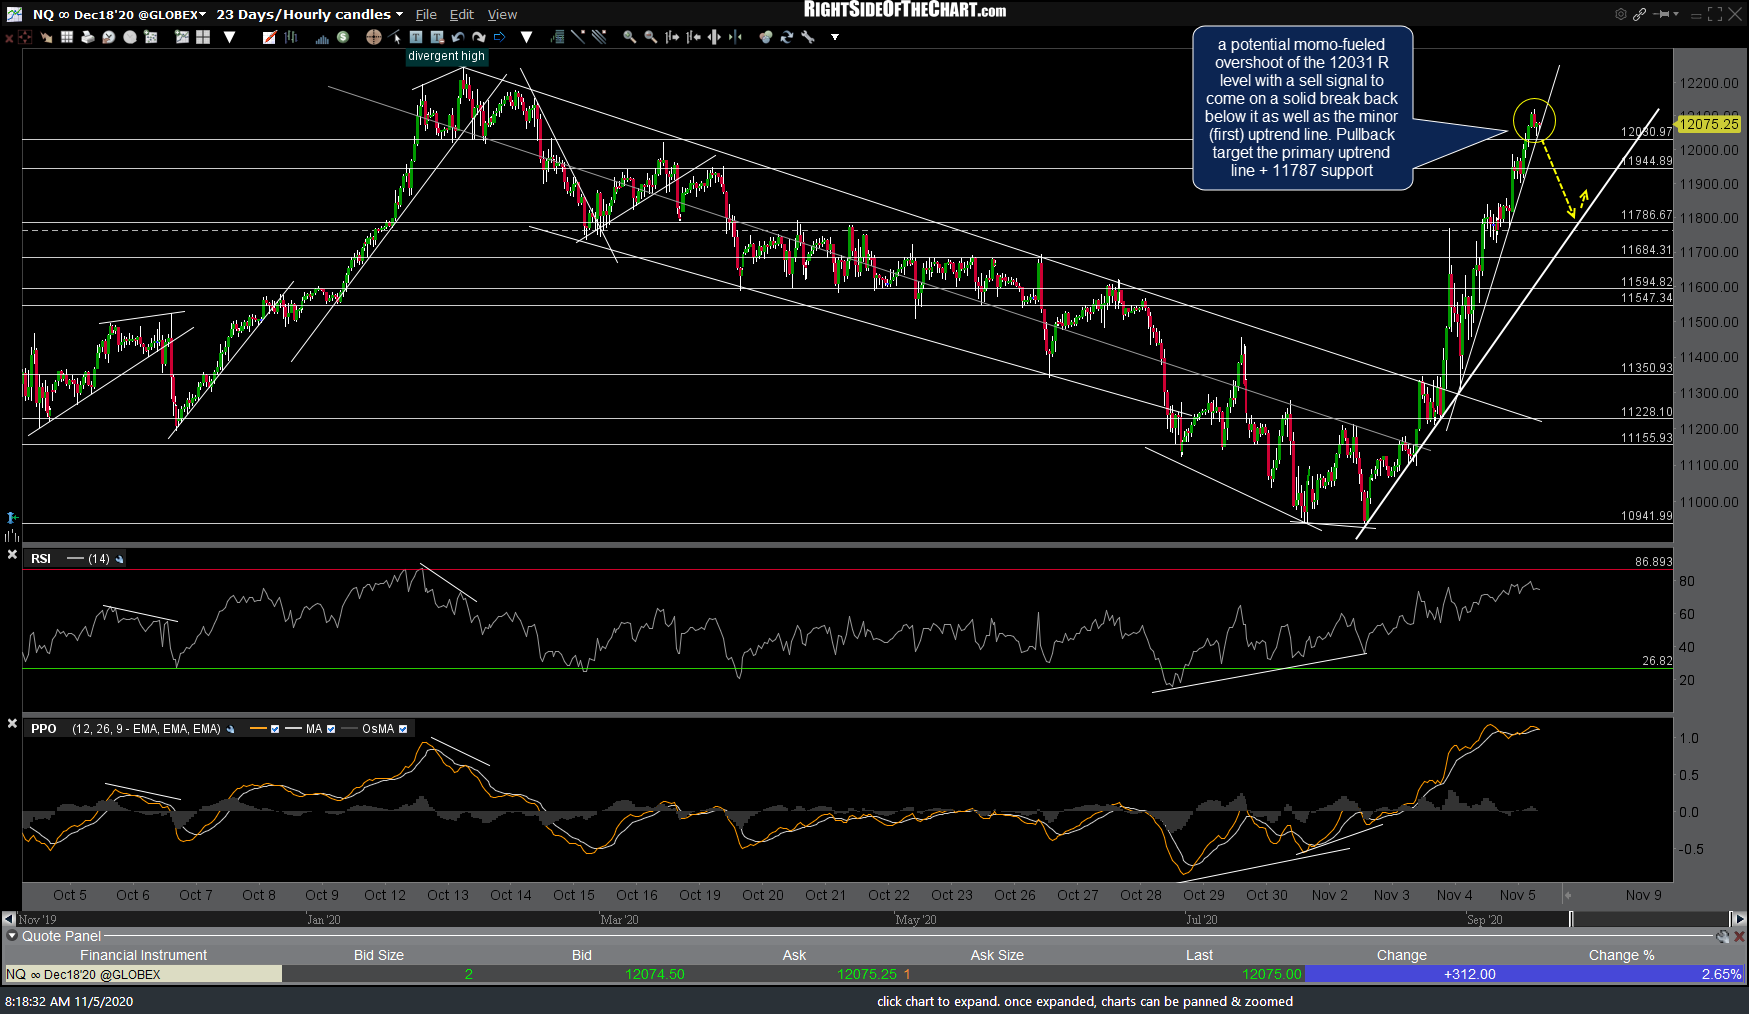
NQ 60m Nov 5th
As with SPY, this bottom of this big errant/false candle from the QQQ pre-market session aligns with a potential pullback target, the bottom of today’s (pending) gap.
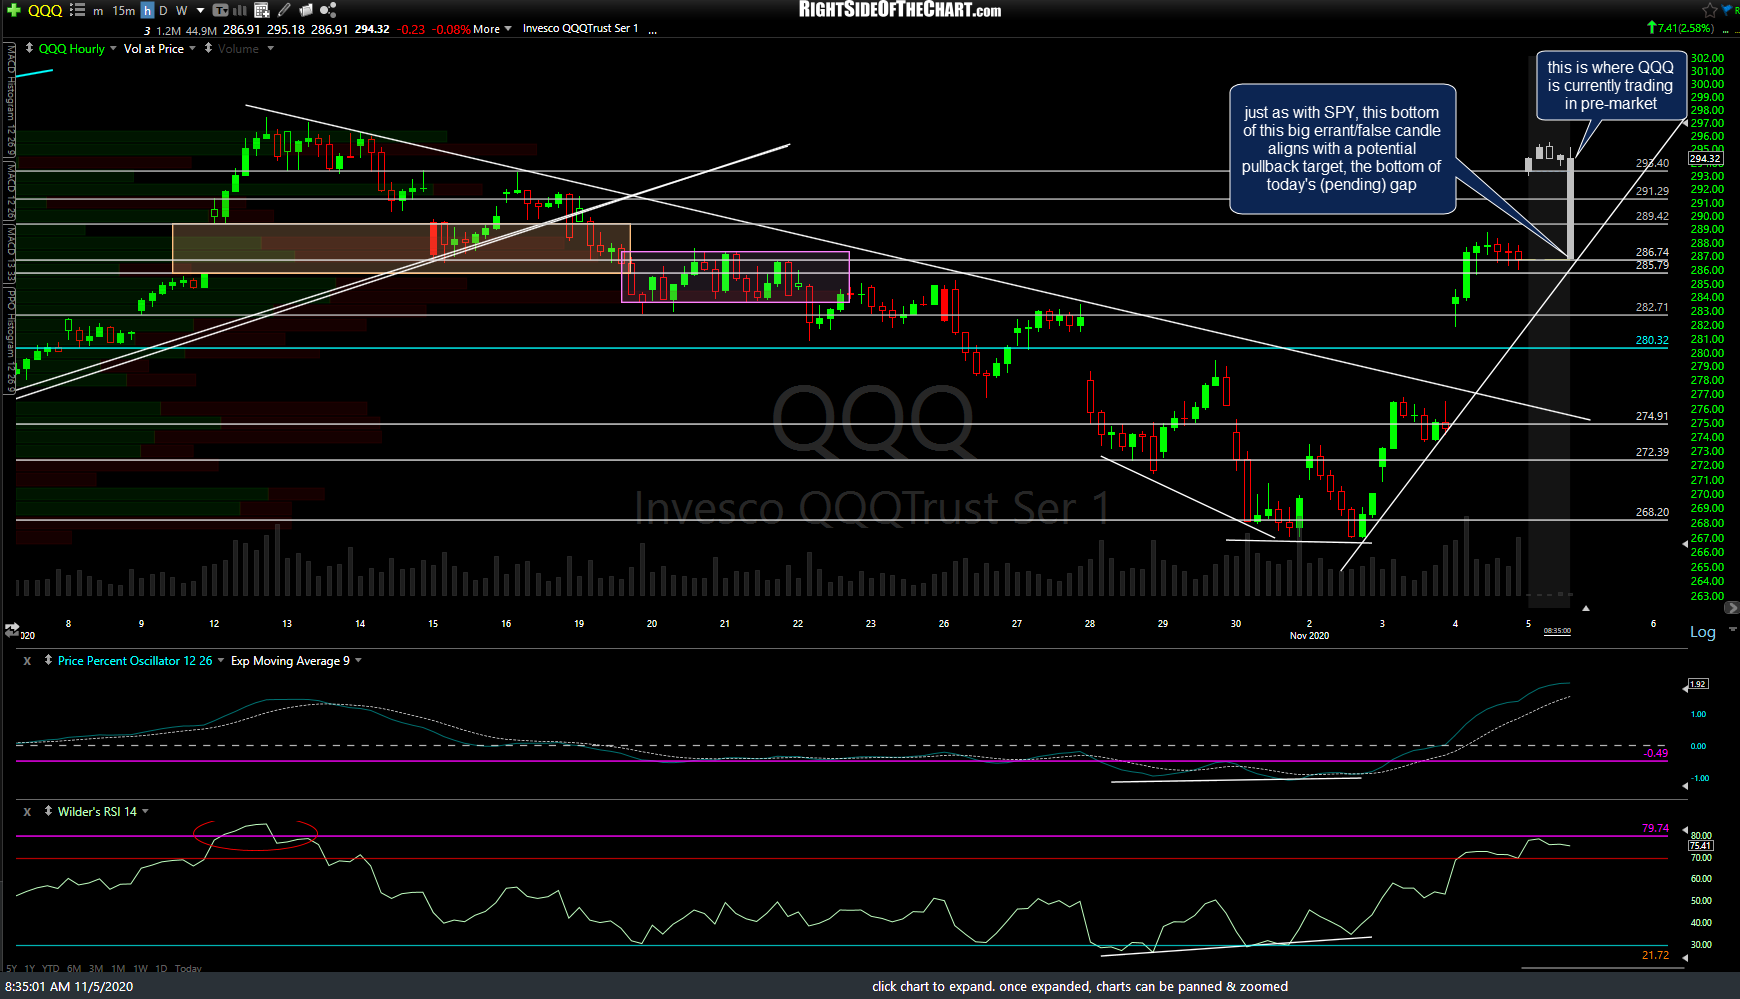
QQQ 60m Nov 5th
Bottom line: No sell signals on the indexes at this time although both /ES & /NQ are sitting on those minor uptrend lines with a sell signal to come once both are taken out with conviction.