
Both QQQ & /NQ (Nasdaq 100 futures) offer an objective yet somewhat aggressive short entry or add-on here at the backtest of the blue uptrend line although the higher-probability entry still remains on a break below yesterday’s lows.

QQQ 60m 2 Jan 5th
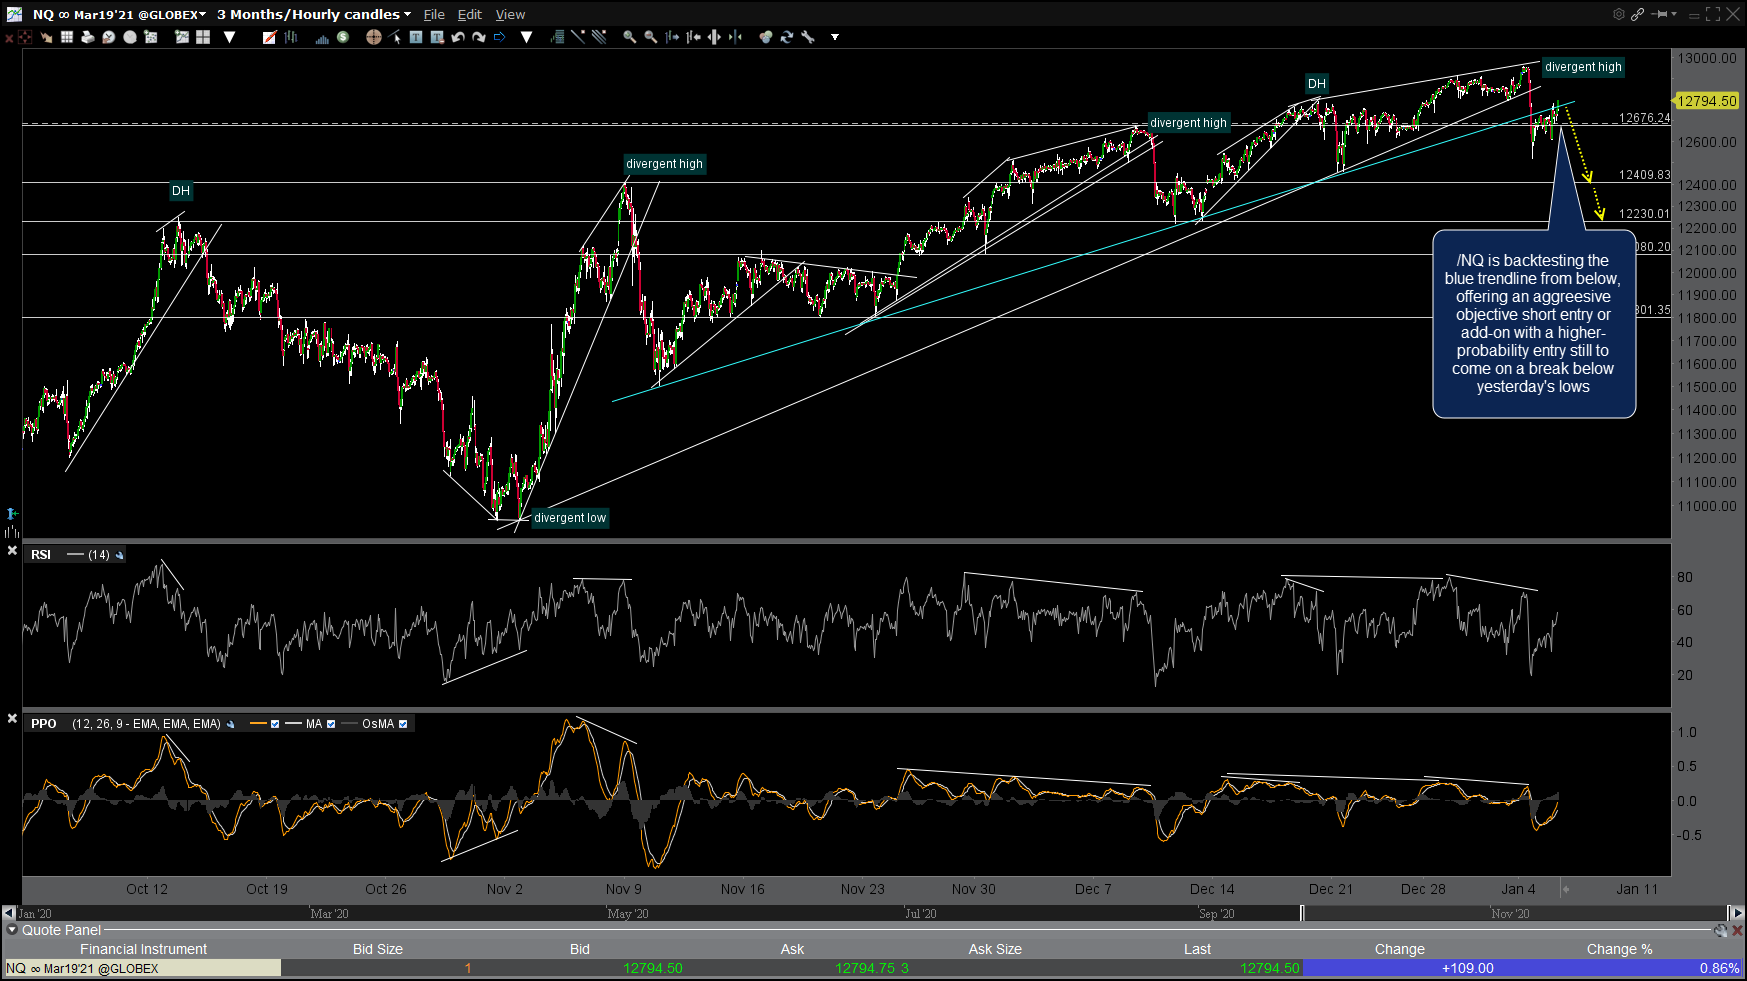
NQ 60m 2 Jan 5th
This snapback rally takes the Q’s back up to just below where the breakdown below the primary (white) trendline off the November 2nd lows occurred so while yesterday’s sell signals on the 60-minute charts have not yet been negated, we still don’t have a confirmed sell signal on the daily time frame which would come on a solid break and/or daily close below yesterday’s lows. Daily chart below.

QQQ daily Jan 5th
SPY is also backtesting the blue trendline from below on the 60-minute chart as well.
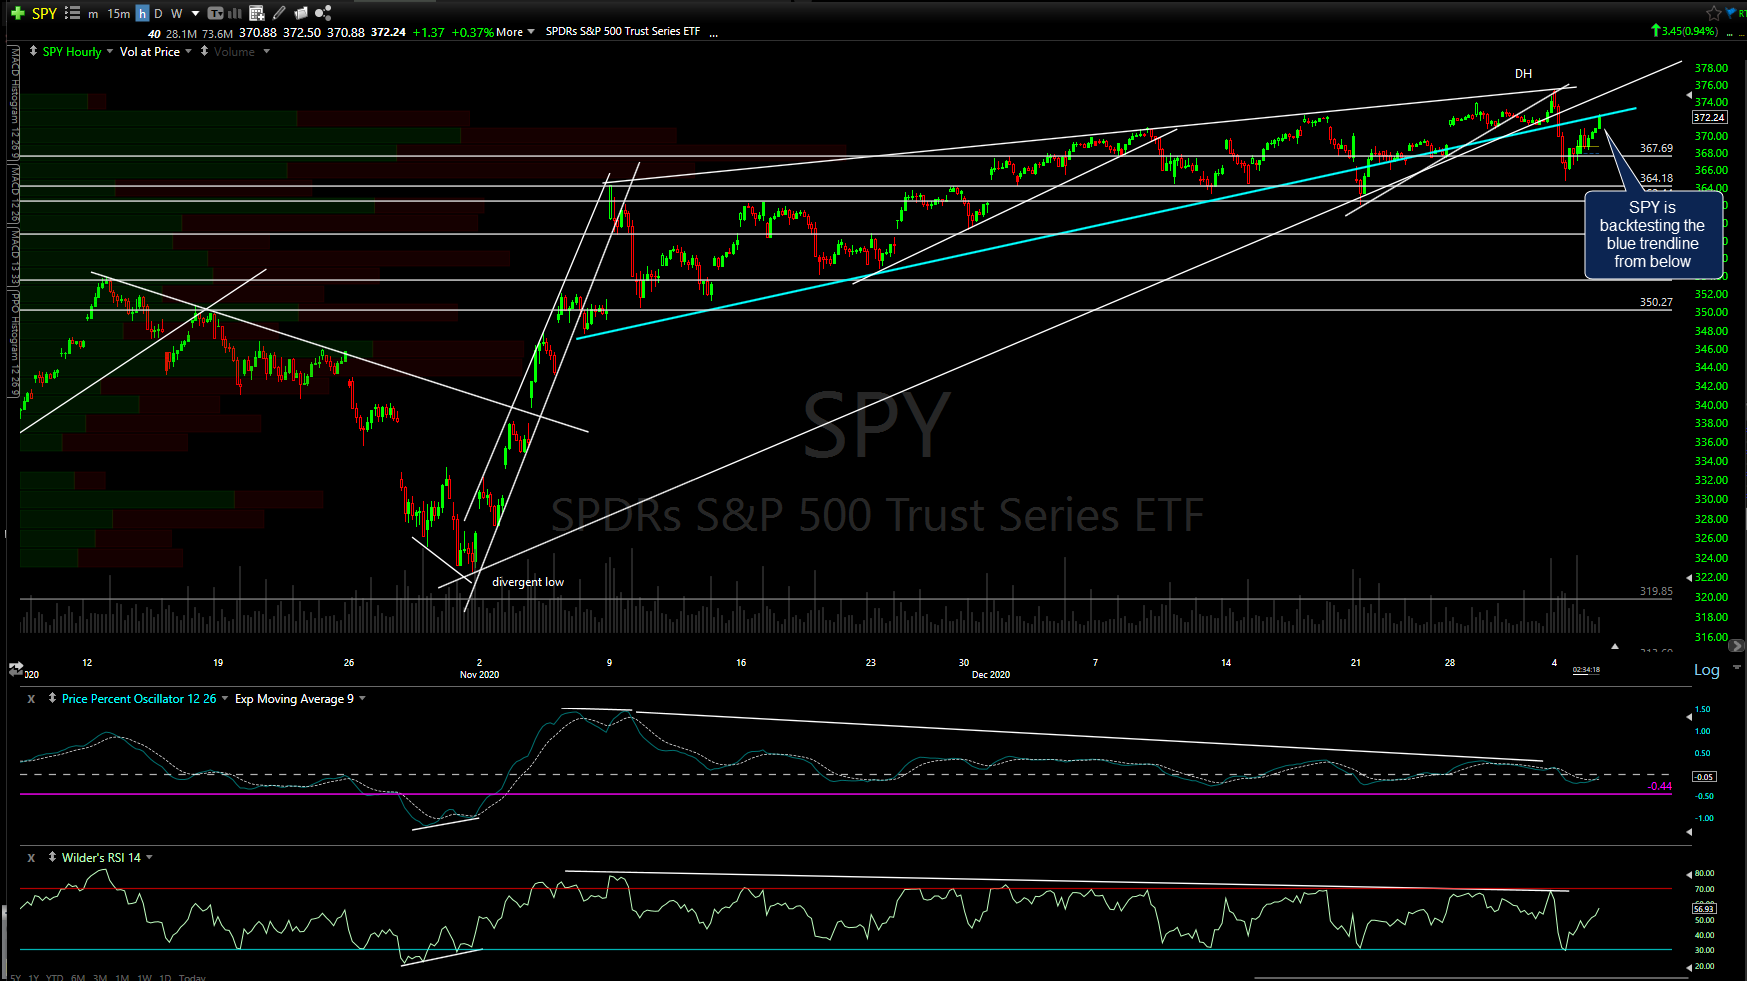
SPY 60m Jan 5th
Again, shorting the indexes here on these backtests is aggressive since the trend is still bullish without any sell signals on the daily or weekly time frames, only those on the intraday (60-minute) charts that occurred yesterday. However, helping to support the case for a short entry on the equity markets here is the fact that /ZN (10-year Treasury Bond futures) has fallen to support at the bottom of the triangle pattern where a reaction is likely. The green arrows show the most likely scenario for the 10-yr bond if a correction has started in the stock market while a solid & sustained breakdown below the pattern (red arrow) would likely mesh with new highs in the stock market.
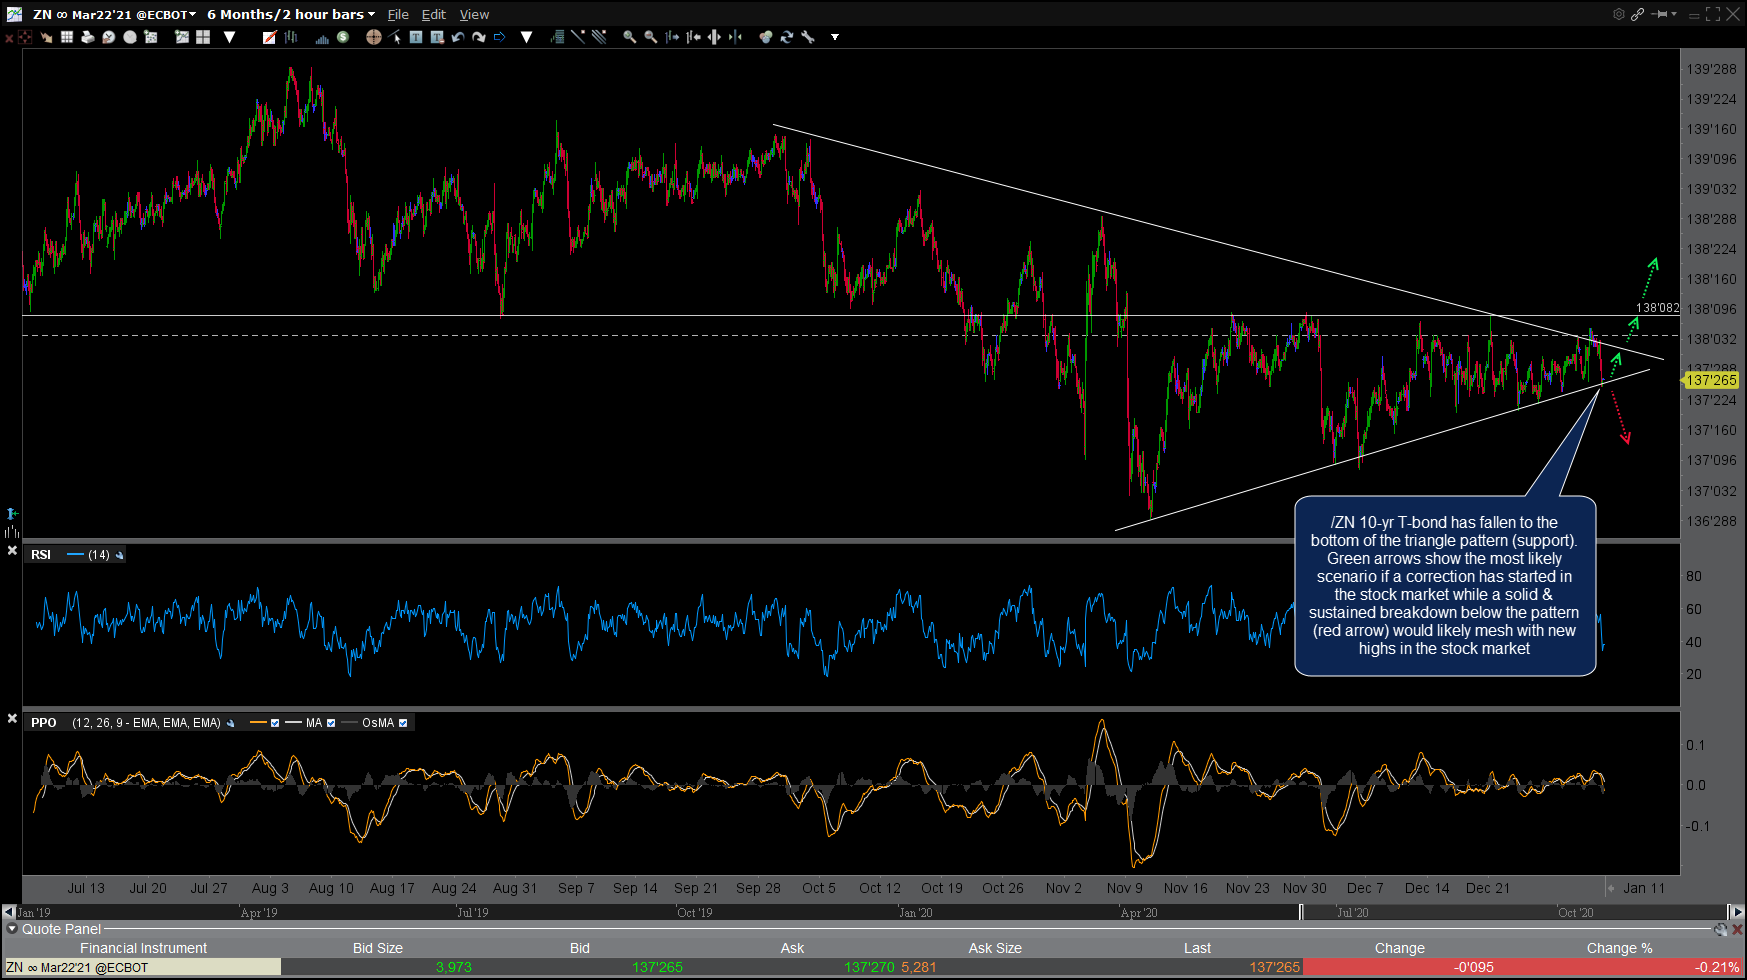
ZN 60m 2 Jan 5th
Bottom line: We still to see yesterday’s lows in SPY & QQQ get taken out to make a solid case for a swing short on the indexes although a case can be made for an objective entry or add-on here with relatively tight stops (1-2%) as that would offer a very attractive R/R profile, considering the downside potential should yesterday’s sell signals stick.