
Yesterday’s alternative scenario (a bounce into the 307.13 resistance level followed by a reversal) is now in play with SPY likely to move lower today & into next week. Previous & updated 60-minute charts below.

SPY 60m June 25th

SPY 60m June 26th
Likewise, yesterday’s alternative scenario (a bounce into the 246.93 resistance followed by a reversal) is also now in play with QQQ likely to move lower today & into next week. While there are no guarantees that SPY & QQQ will reverse here followed by the next leg down in what could prove to be a much larger correction off the June 9th high, I can say that this bounce into resistance offers an objective short entry or add-on to the any of the stock index ETFs or futures contracts with a stop somewhat above. Previous & updated 60-minute charts of QQQ below.

QQQ 60m June 25th
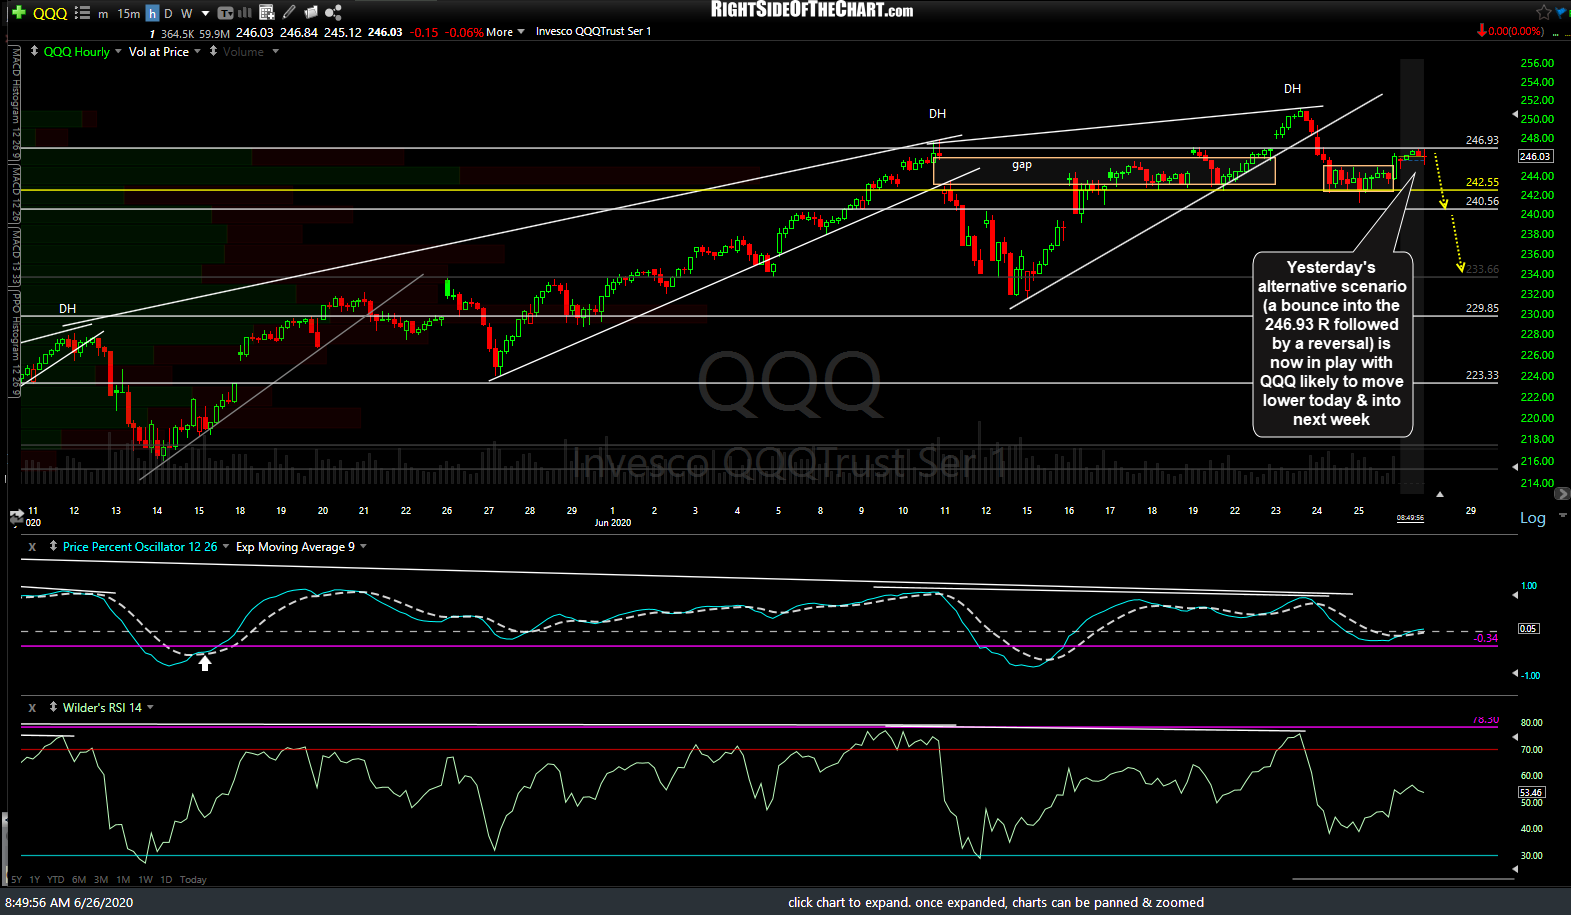
QQQ 60m June 26th
I’ll also be monitoring /NQ (Nasdaq 100 futures) for the formation/finalization of a right should (or two right shoulder’s) of what could develop into a potential Complex Head & Shoulders Topping pattern on the 60-minute time frame. As of now, this is only a potential H&S pattern. Ideally, there should be volume expansion on the move down off both the Head as well as the right shoulder in order to help validate that potential topping pattern. Should a right shoulder (or two) form, a sell signal would come on a solid break down below the neckline of the pattern.

NQ 60m June 26th