
Watching the market trade the last couple of days leading up to an FOMC meeting is like watching paint dry. So far this week, the broad market (S&P 500) has put in two candles so small you almost need a microscope to see them, moving slightly higher by a mere 1/4th of 1% so far this week. As a type this, we have exactly 24 hours to go before the FOMC rate announcement & subsequent statement is released tomorrow so I’m expecting more of the same until then.
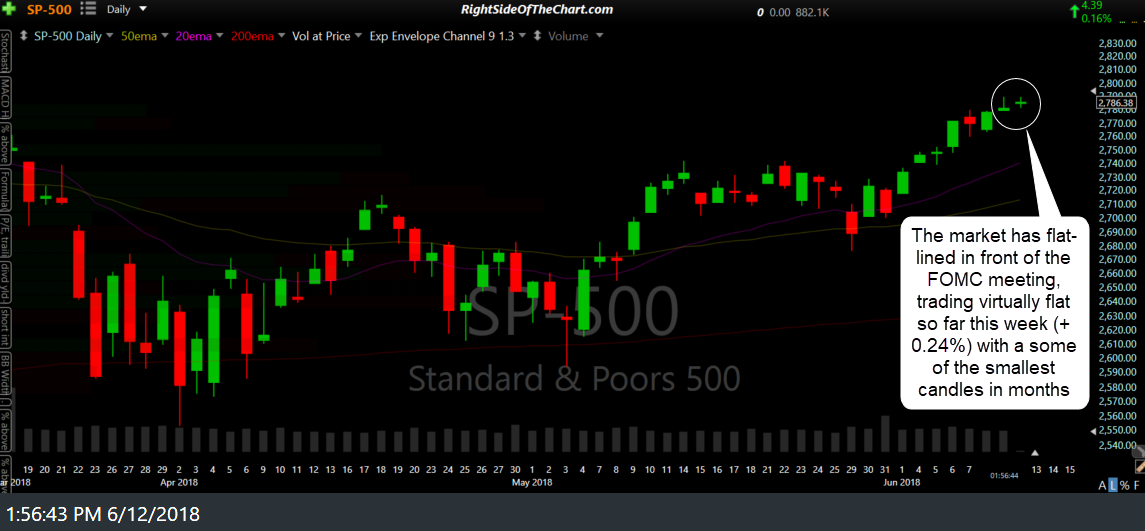
$SPX daily June 12th
With that being said, here are the updated 60-minute charts of SPY & QQQ along with my observations. As of now, the PPO signal line remains above zero on both the SPY & QQQ 60-minute charts, confirming their near-term trends as bullish the negative divergences continue to build & warn of a likely impending trend change with a sell signal to come on a break below the uptrend line on QQQ.
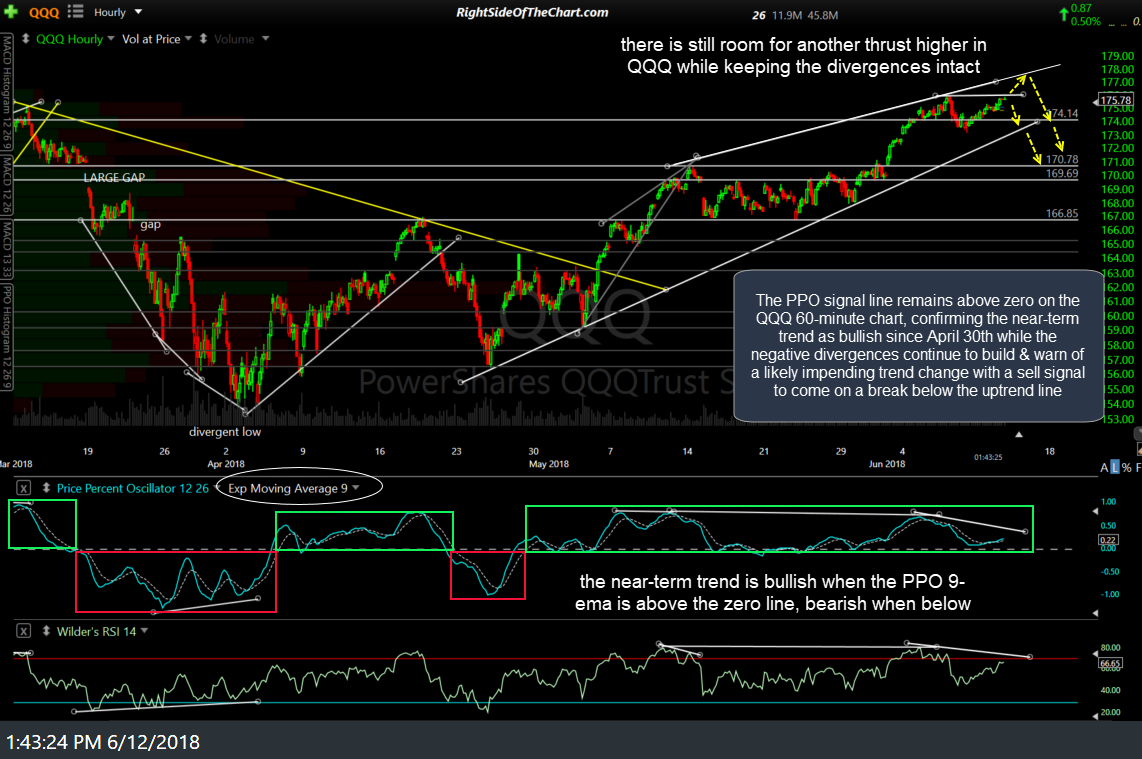
QQQ 60-min June 12th
SPY has crossed slightly below its respective uptrend line today but far from impulsive, plus, whipsaw signals are usually quite common during the low-volume grinds leading up to FOMC meetings.
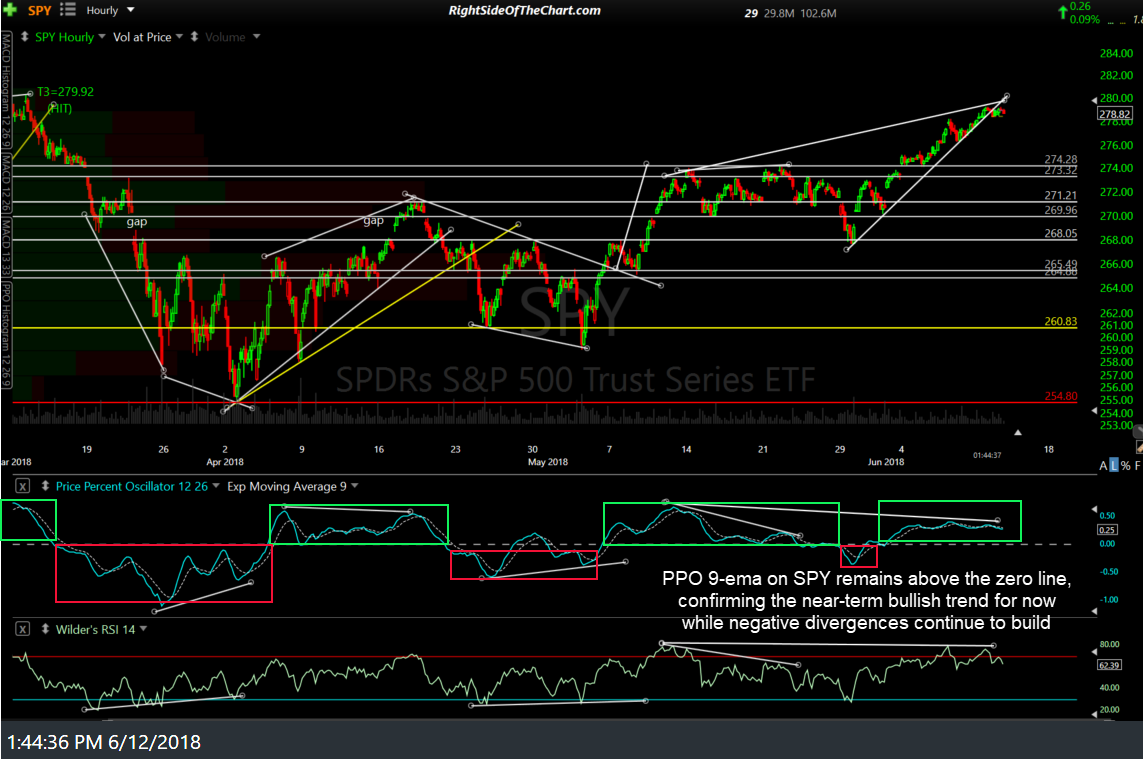
SPY 60-min June 12th
Bottom line: Later this week we should have a better idea of whether these divergences are likely to play out for a correction or if they will be burned through, with the market moving higher in the wake of the FOMC announcement.
As I don’t plan to do any trading over the next day or so, I will only be periodically checking in on the trading room & will provide charts opinions & answer any questions at my earliest convenience.