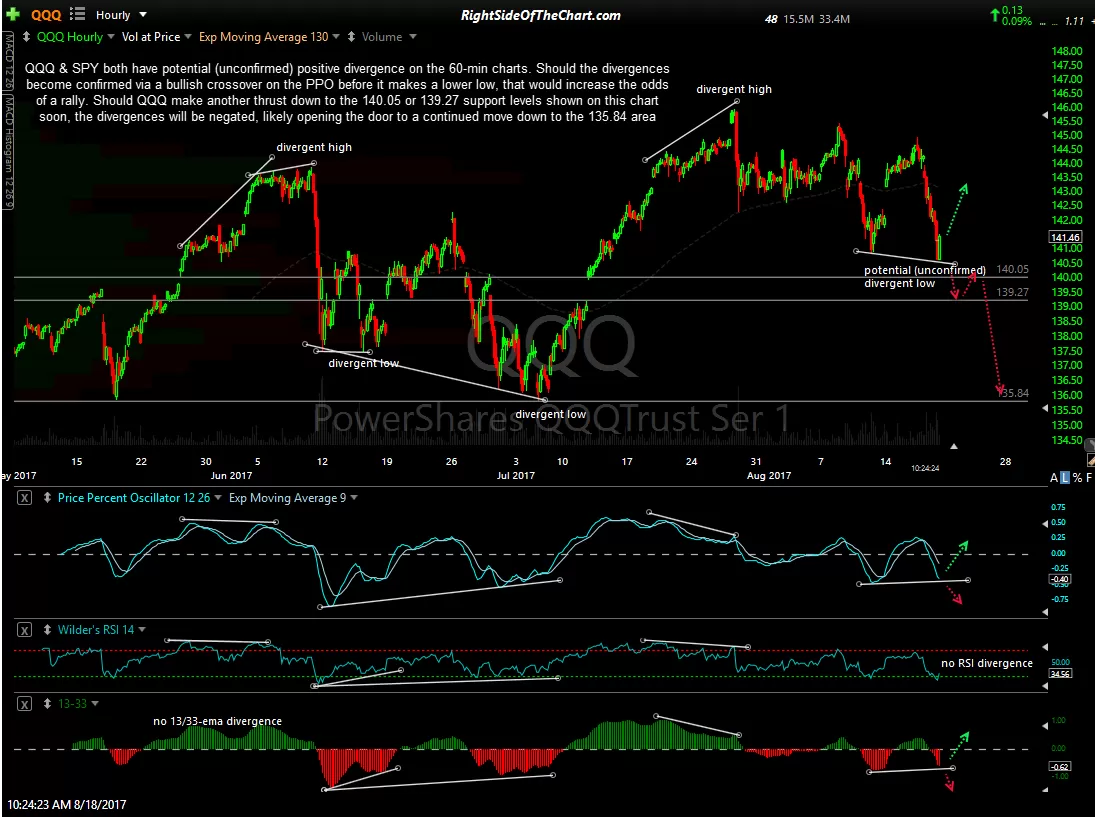
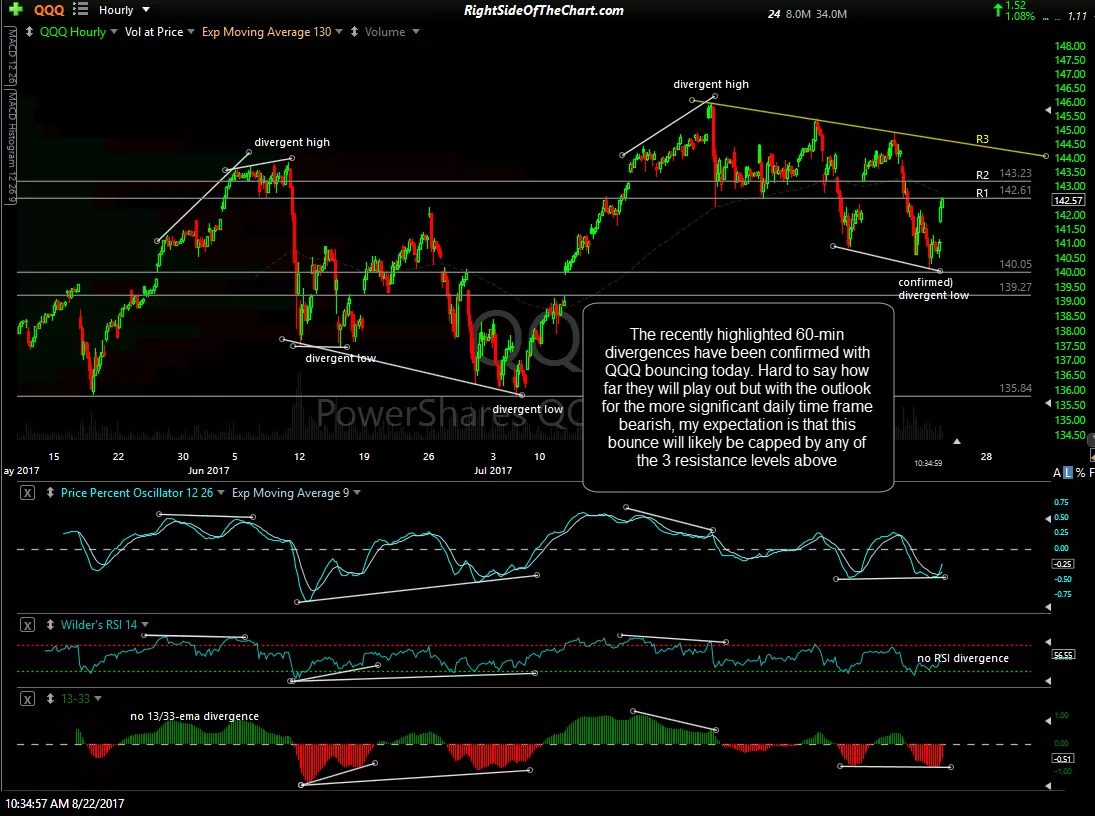
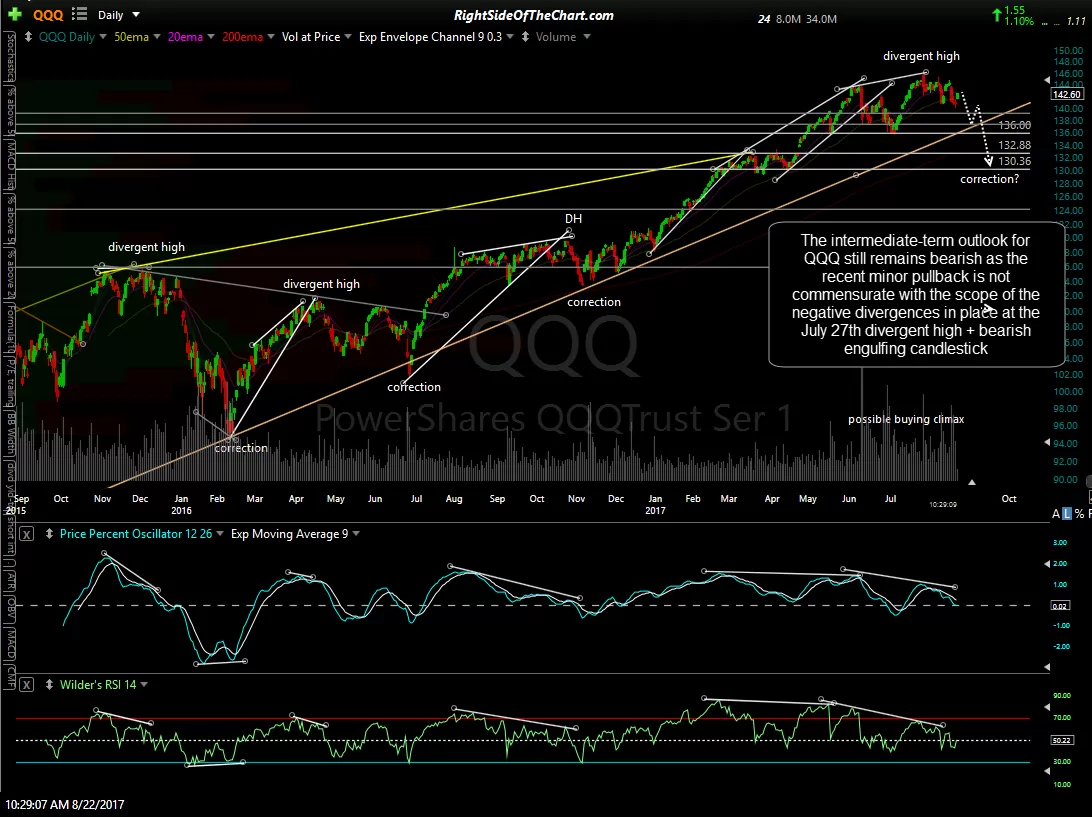
The recently highlighted 60-min divergences (first chart below from Aug 18th) have been confirmed with QQQ bouncing today (2nd chart). Hard to say how far they will play out but with the outlook for the more significant daily time frame bearish, my expectation is that this bounce will likely be capped by any of the 3 resistance levels above on the updated 60-minute chart.
-

- QQQ 60-min Aug 18th
-

- QQQ 60-min Aug 22nd
-
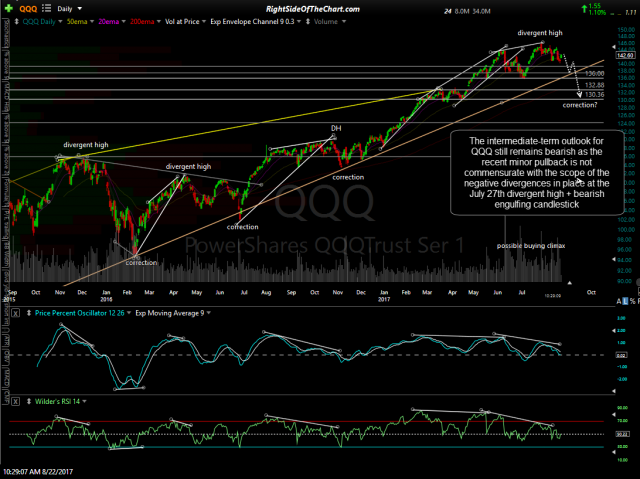
- QQQ daily Aug 22nd
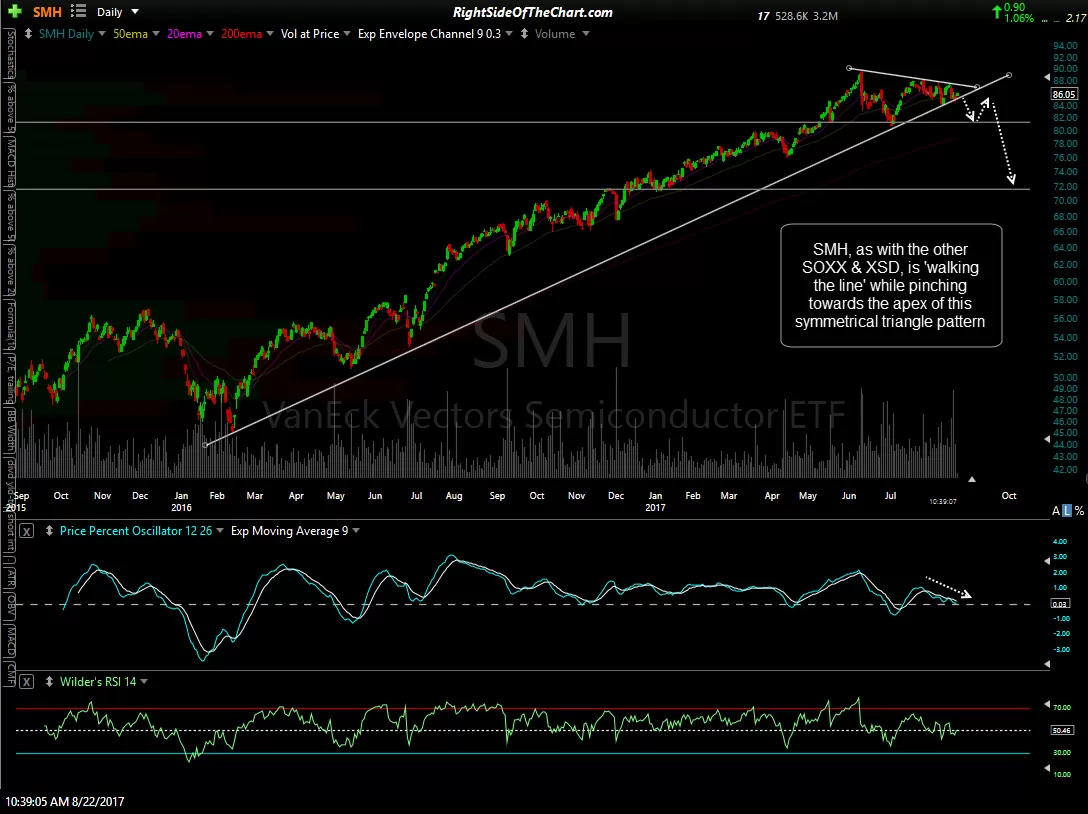
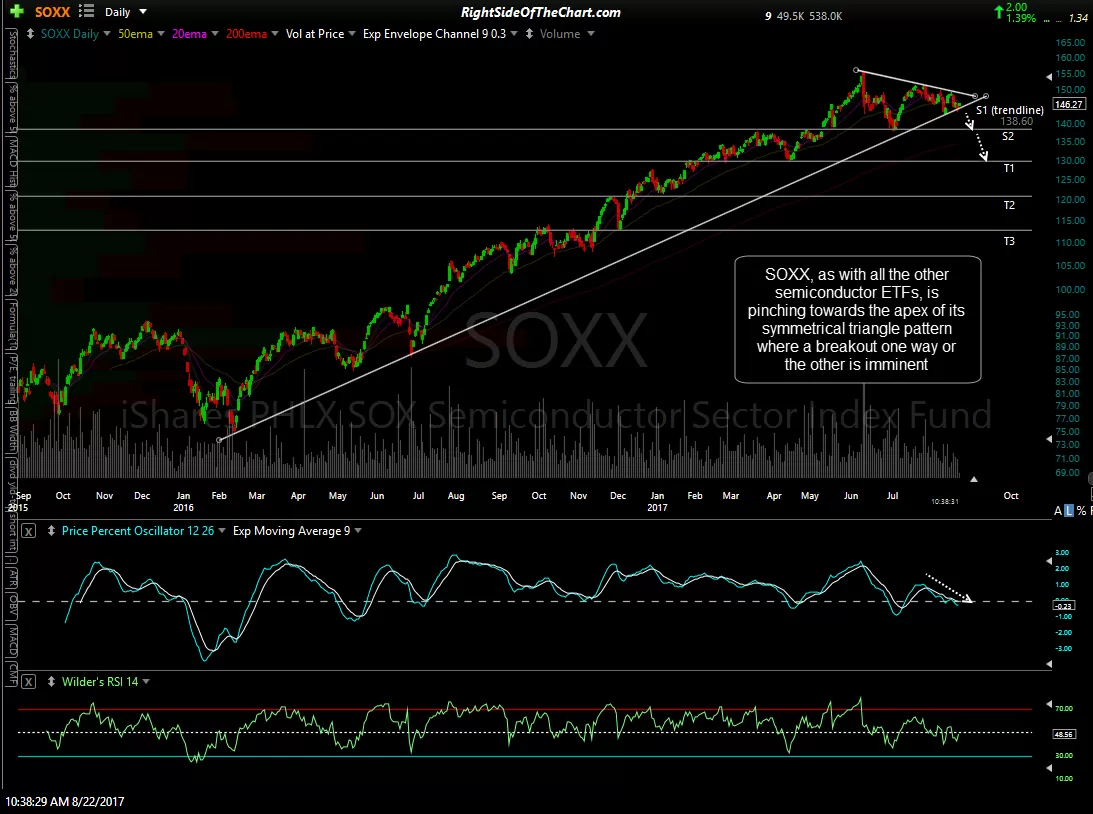
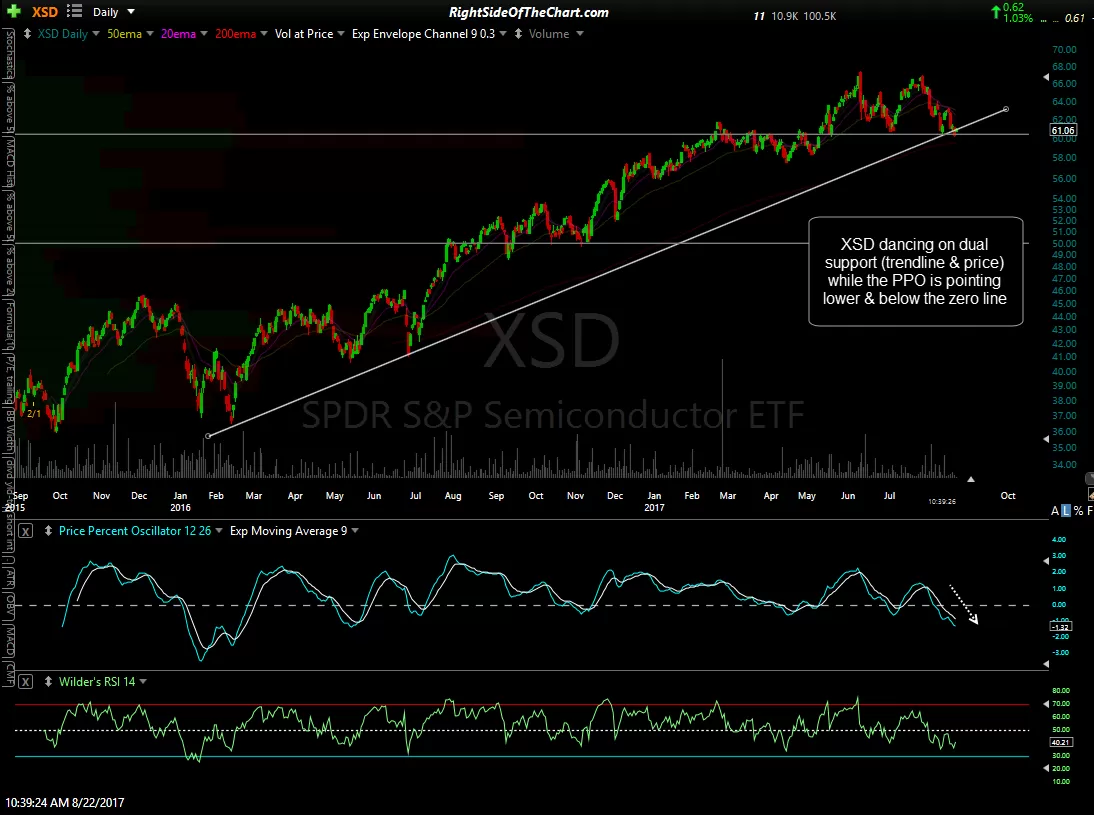
The story on the three main semiconductor sector ETFs is the same: They are all walking up trendline support while pinching towards the apex of a symmetrical triangle pattern where a breakout, one way or the other, is now imminent. Note how the PPO, a momentum indicator similar to the MACD, is currently pointing lower on all three & has already made a bearish zero-line cross on XSD. As the trend in the semiconductors has been resilient, it would be preferable to wait for a solid trendline break and/or daily close below on all three of these semiconductor ETFs for a sell signal.
-

- SOXX daily Aug 22nd
-

- XSD daily Aug 22nd
-
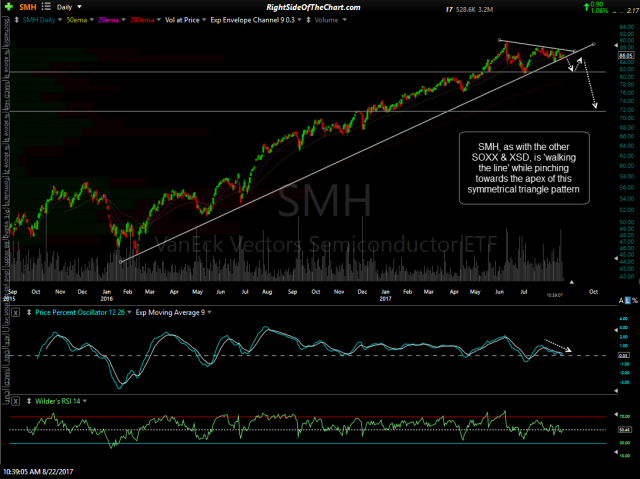
- SMH daily Aug 22nd