
QQQ stalling out & reversing (so far) off the significant 280.32 resistance level highlighted in recent videos. Bullish if 280.32 is taken out with conviction although at this time I am expecting at least a tradable pullback off this level. 60-minute chart below.
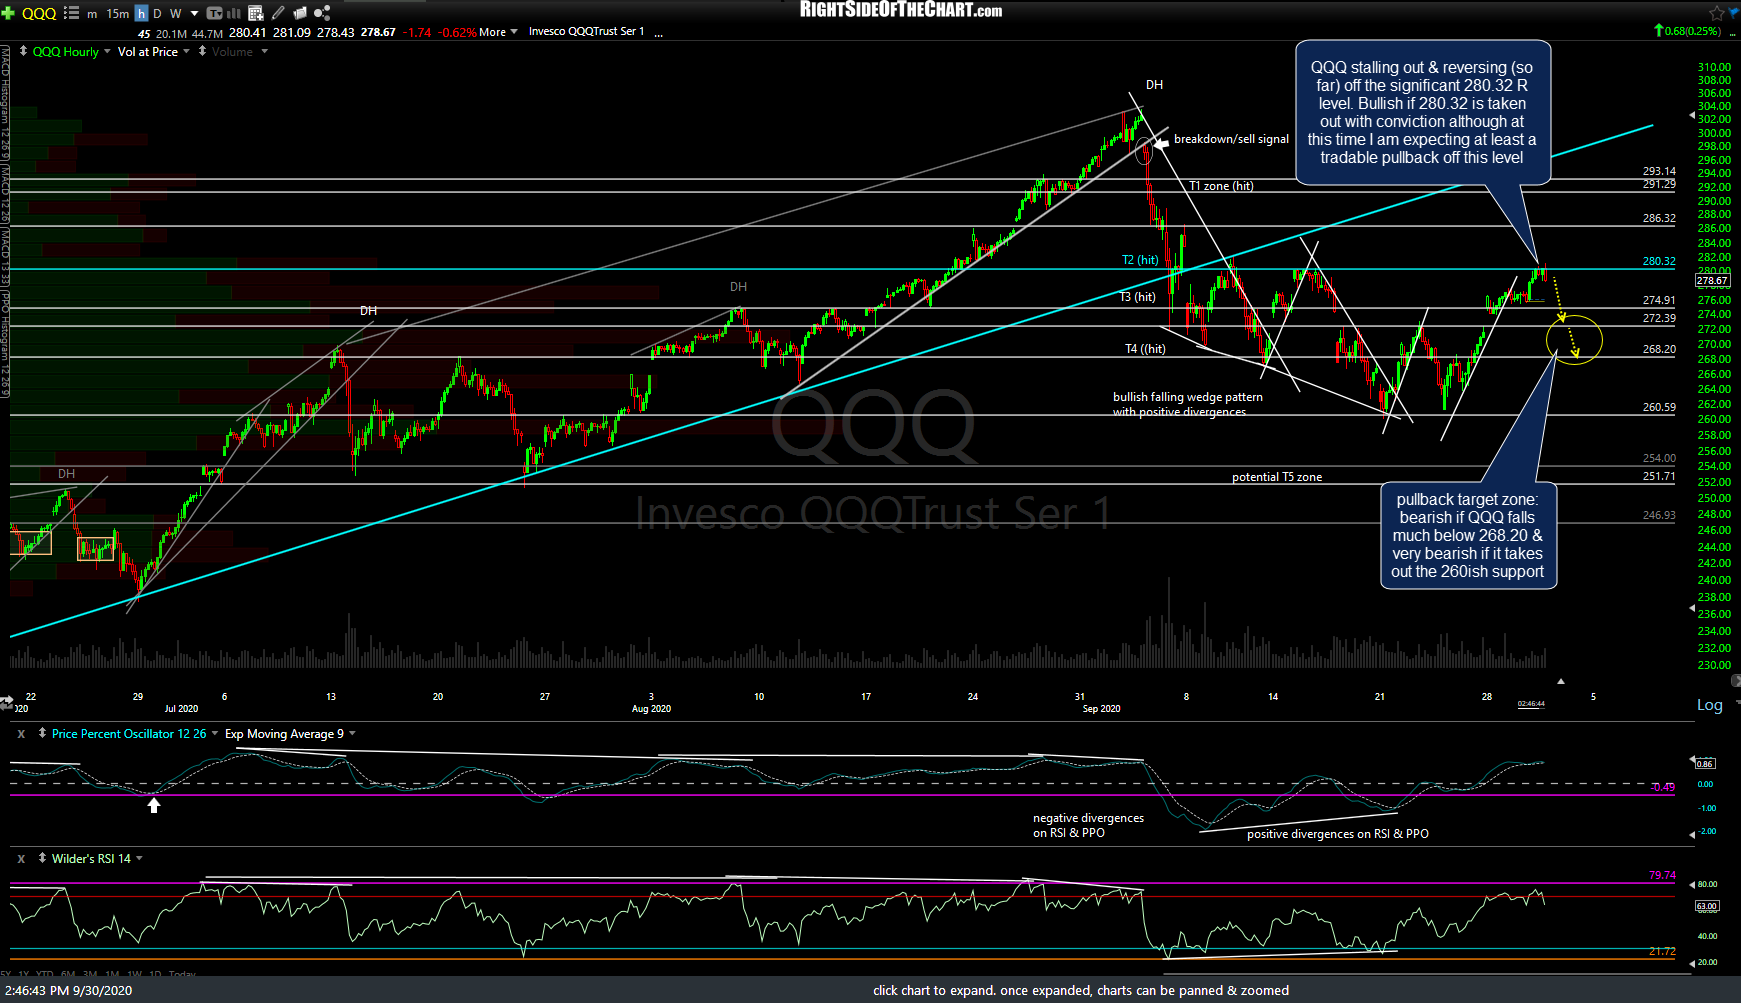
QQQ 60m Sept 30th
Also as anticipated, so far we have a reversal on the initial test of the key 11547ish resistance level & price target on /NQ (Nasdaq 100 futures) with the potential (but still unconfirmed) negative divergences continuing to build. Bullish if /NQ can take out 11550 with conviction, bearish if 11175 (previous reaction low) goes with conviction. If those potential divergences are confirmed (via a bearish crossover on the PPO soon), that would most likely coincide with a drop down to that minimum pullback target zone. If the Q’s can power back up soon & take out today’s highs with conviction, that would be hard to chalk up to as anything but bullish.
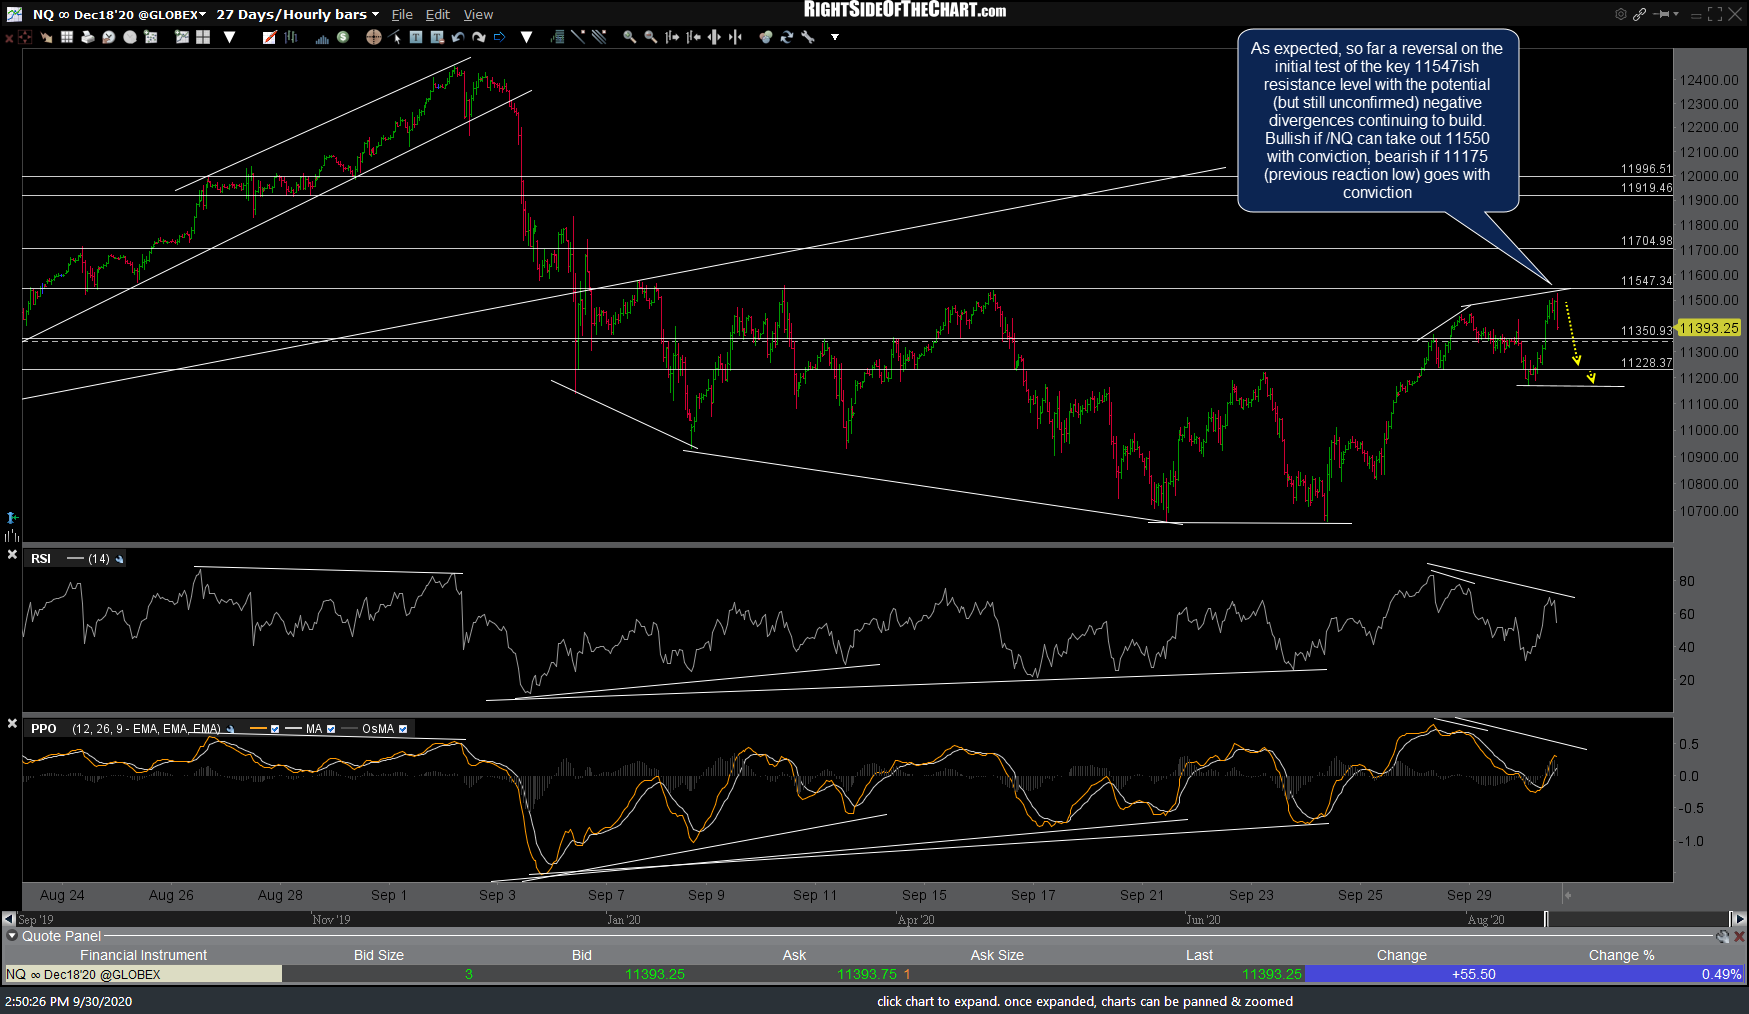
NQ 60m Sept 30th
SPY has put in a small divergent high at the rejection off today’s backfill of the 9/17 gap on this 60-minute chart. While QQQ & /NQ are currently testing significant resistance levels, SPY has what I believe to be a comparable resistance level about another 1.15% above today’s high, with that resistance around 342.30. It would be quite bullish IF SPY can take out the 342.40ish resistance level with conviction while bearish of the bottom of my pullback target zone (329.58) is clearly taken out. 60-minute chart below.
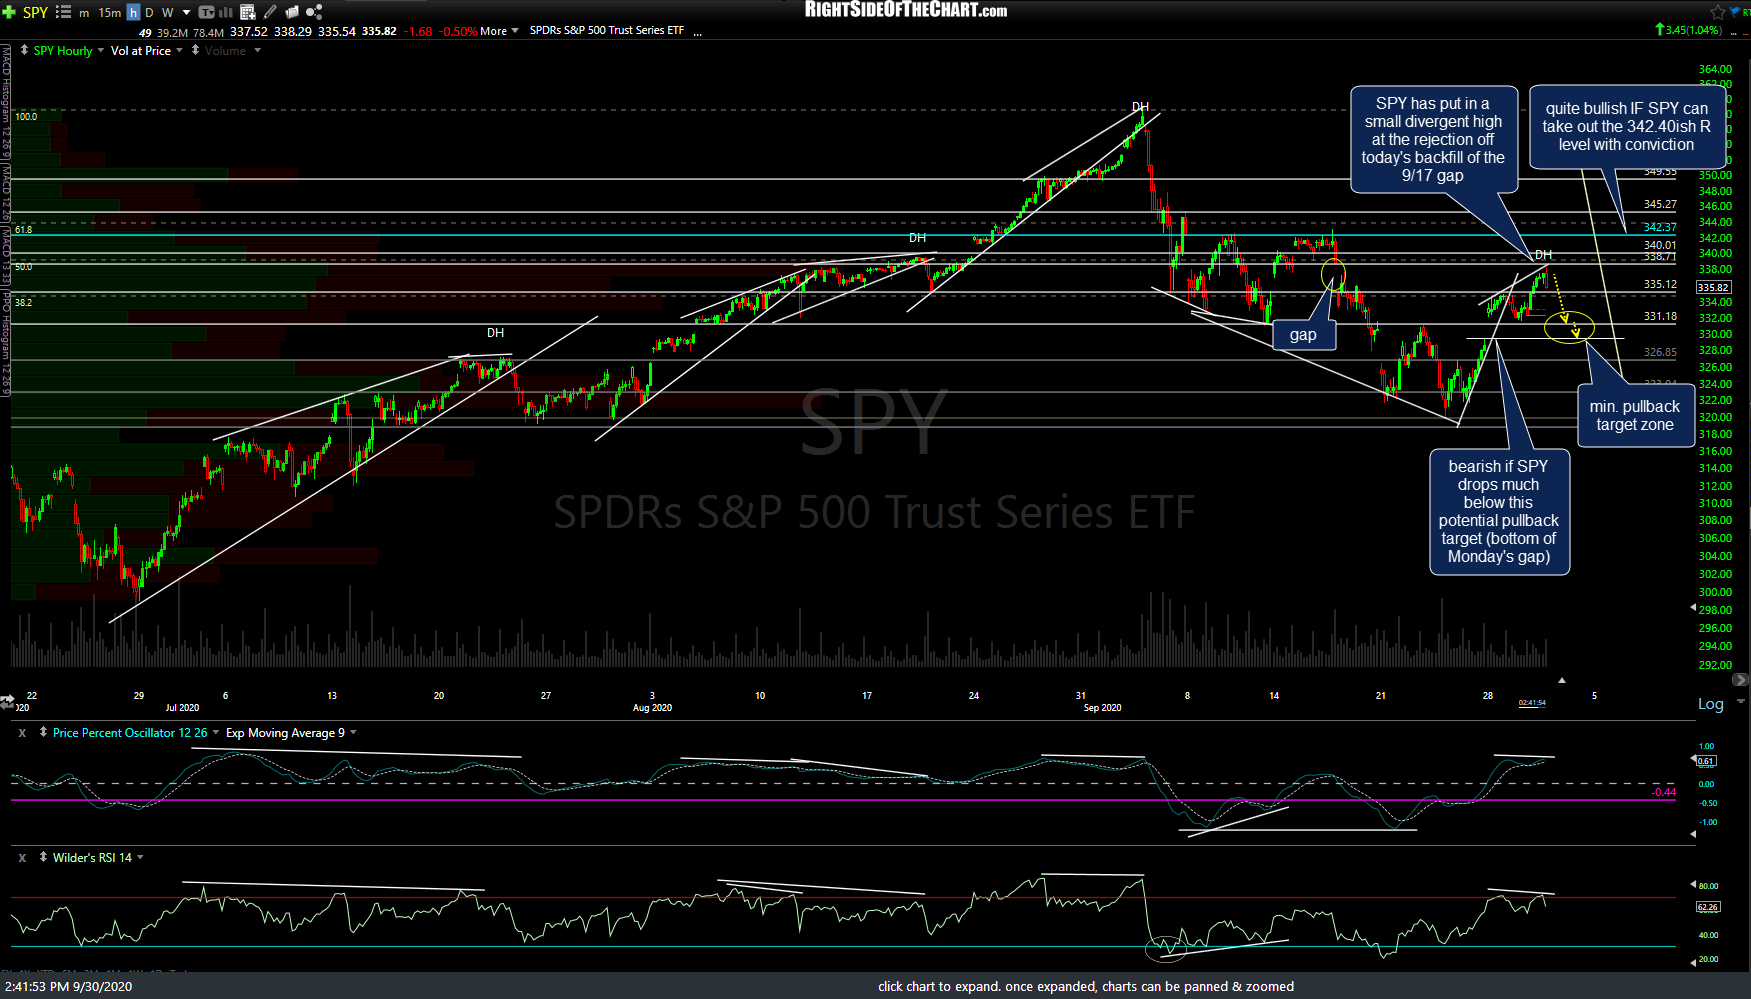
SPY 60m Sept 30th