
Here’s the QQQ daily chart showing what was likely a momentum-fueled overshoot of the key 284.38 resistance level on Friday although a solid close above that level this week would be bullish, especially on the heels of last month’s bullish engulfing candlesticks & divergent low on the major stock indices. With the very short-term indicators overbought & divergences forming on the 60-minute charts of the stock futures, I favor at least a tradable pullback today and/or into tomorrow, even if we get a marginal new high today.
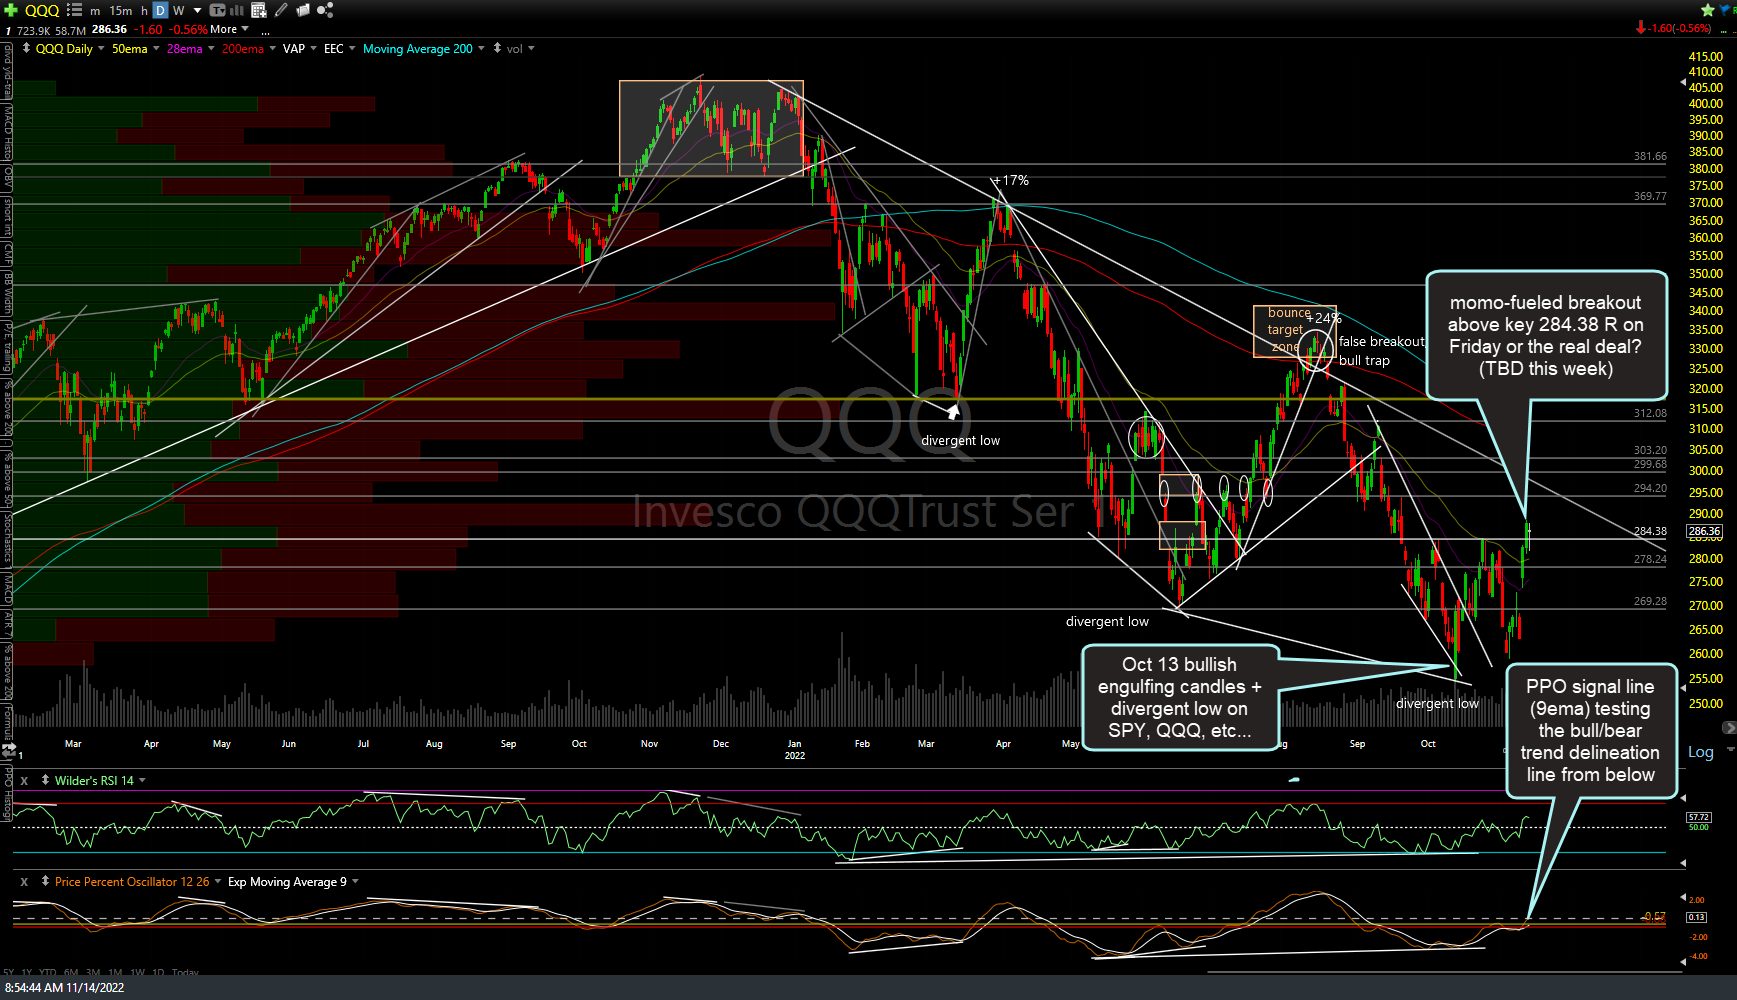
QQQ daily Nov 14th
Negative divergences are starting to build on /NQ (Nasdaq 100 futures) as it tests the 11780ish resistance on this 60-minute chart & we as divergences forming on the 60-minute chart of /ES (S&P 500 futures).
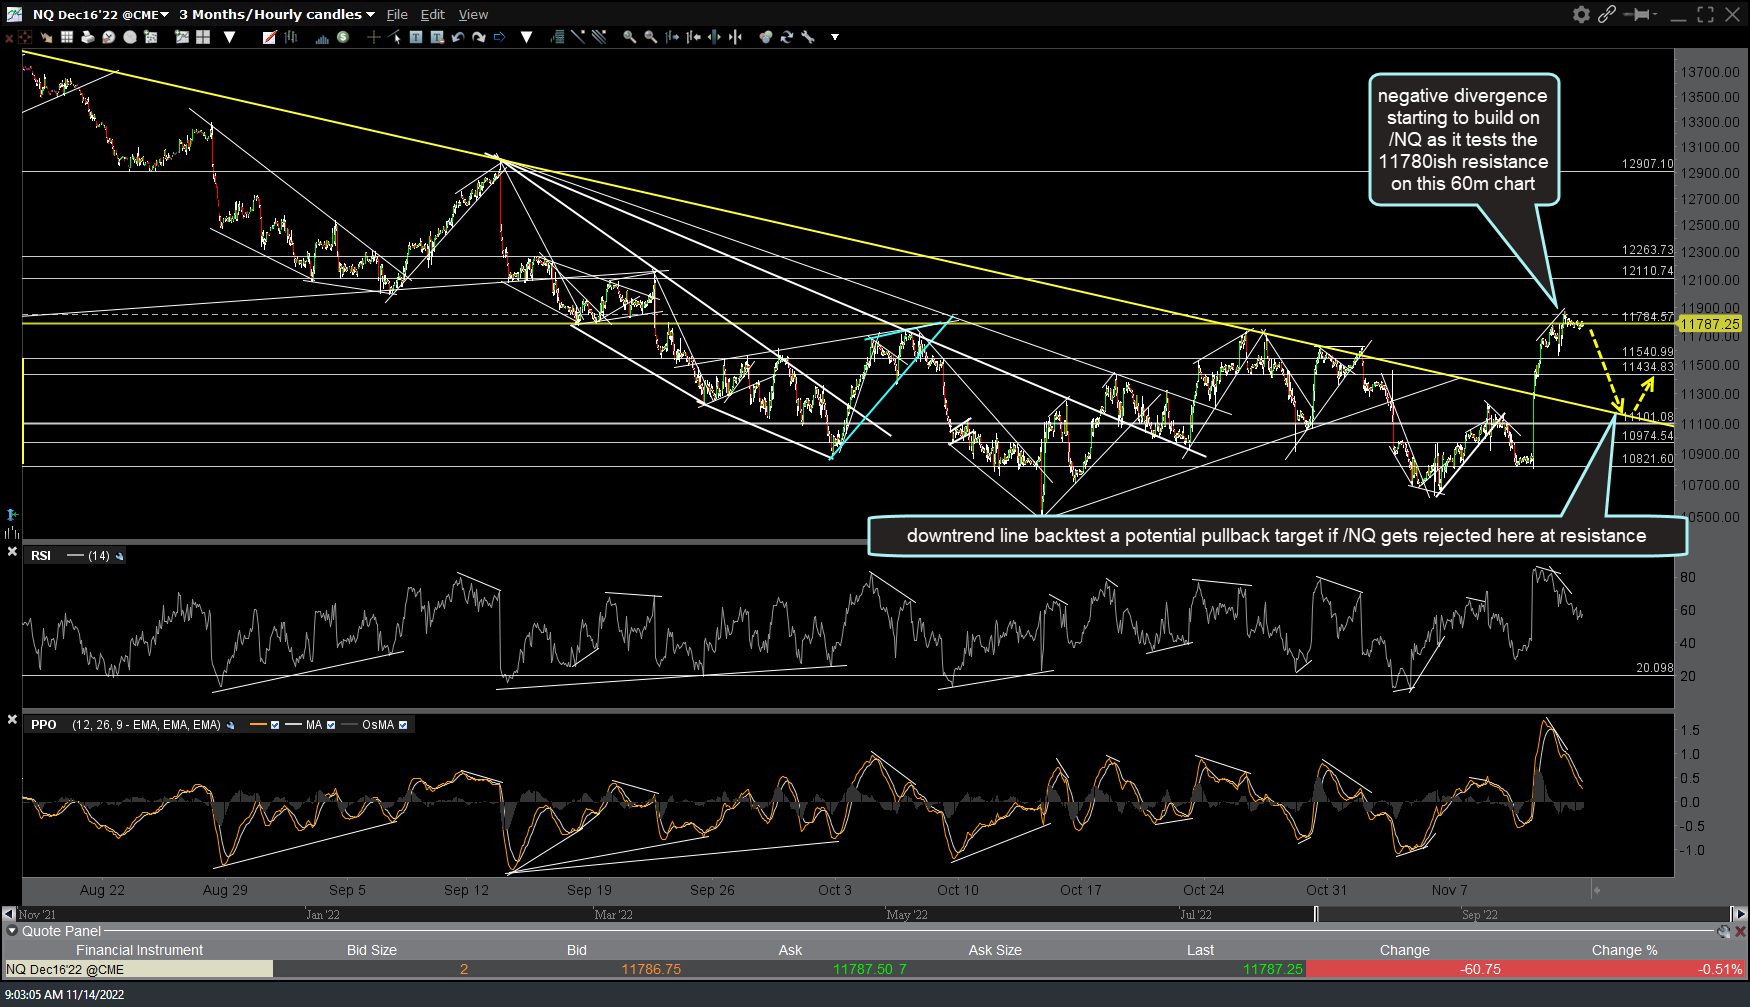
NQ 60m Nov 14th
The 120-minute charts below have /NQ trading on the key 38.2% Fib retracement (off mid-Aug high) & the 11780ish price resistance & /ES just below the key 61.8% Fib retracement off the mid-Aug high.
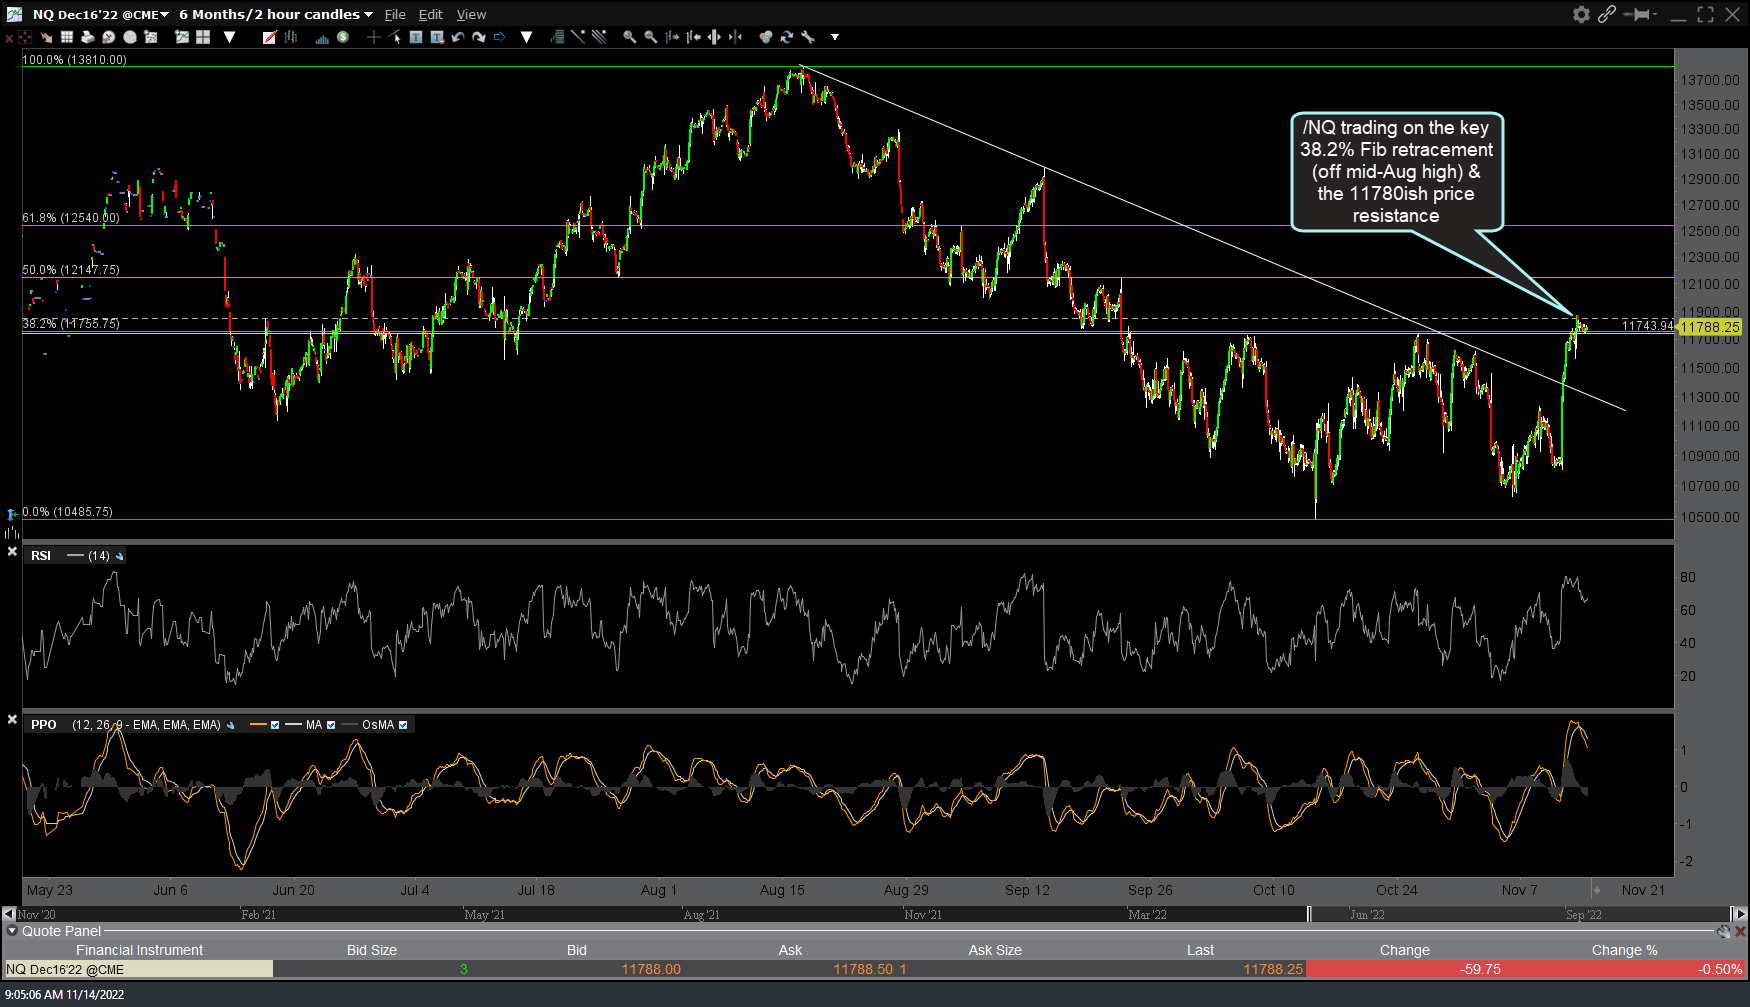
NQ 120m Nov 14th
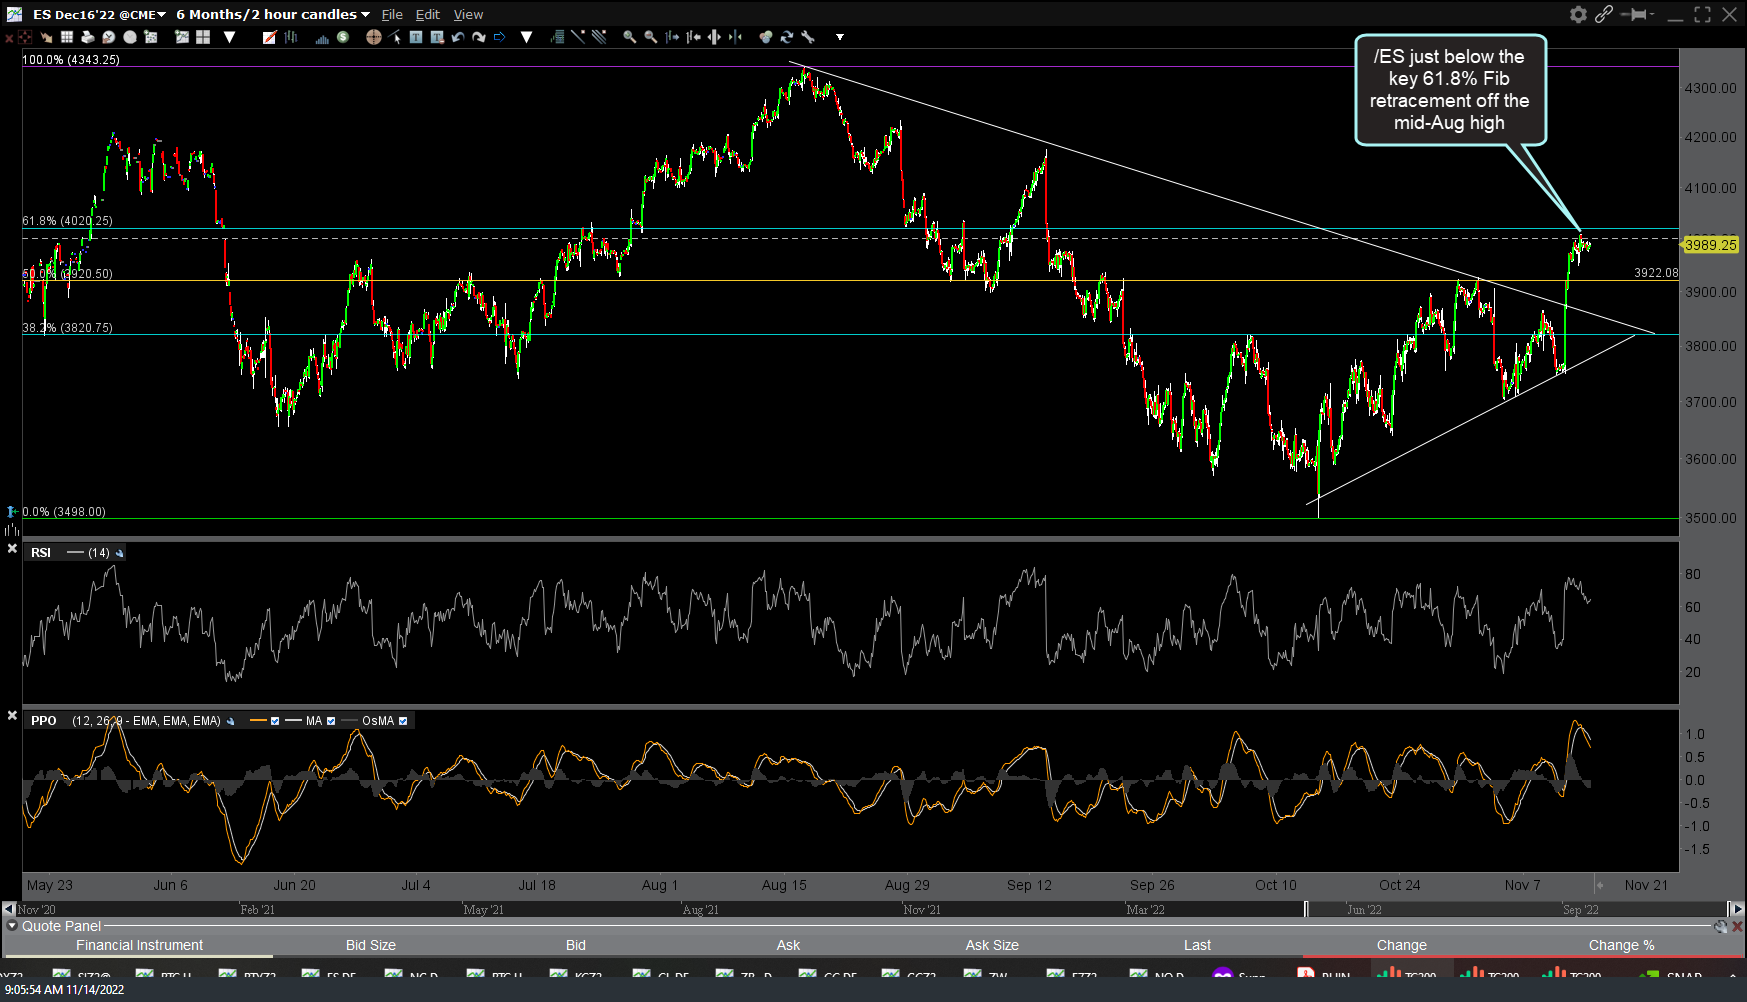
ES 120m Nov 14th
Some of the potential market-moving earnings reports this week are WMT & HD (Tuesday before-market-open, BMO); TGT, LOW, & TJX Wed BMO; NVDA & CSCO Wed AMC; BABA, M, KSS, & BJ Thurs BMO; & PANW, AMAT, & GPS on Thurs AMC.
On the economic calendar we have PPI tomorrow; Retail Sales & Industrial Production on Wed; Housing starts, Jobless Claims, & the Philly Fed Manufacturing Index on Thursday followed by Existing Home Sales on Friday.