
Here are a few charts I’m watching as we kick-0ff the final trading day of 2024.
While the recent sell signals, including the bearish engulfing candle on the weekly chart of QQQ & breakdown below the uptrend line off the Aug 5th low remain solidly intact for now, there’s decent (decent but not great) chance that yesterday’s divergent low on the 15-minute chart of QQQ has a little more upside left before the next leg down + year-end window dressing effect. Potential near-term targets for active trades shown by the arrow breaks below (solid arrows preferred, dotted arrow current max. bounce target).

QQQ 15m Dec 31st
WEAT (wheat ETN) & /ZW (wheat futures) still testing the 60-minute & daily downtrend line with the next buy signal to come on a solid break and/or close above it. 60-minute chart of WEAT below.
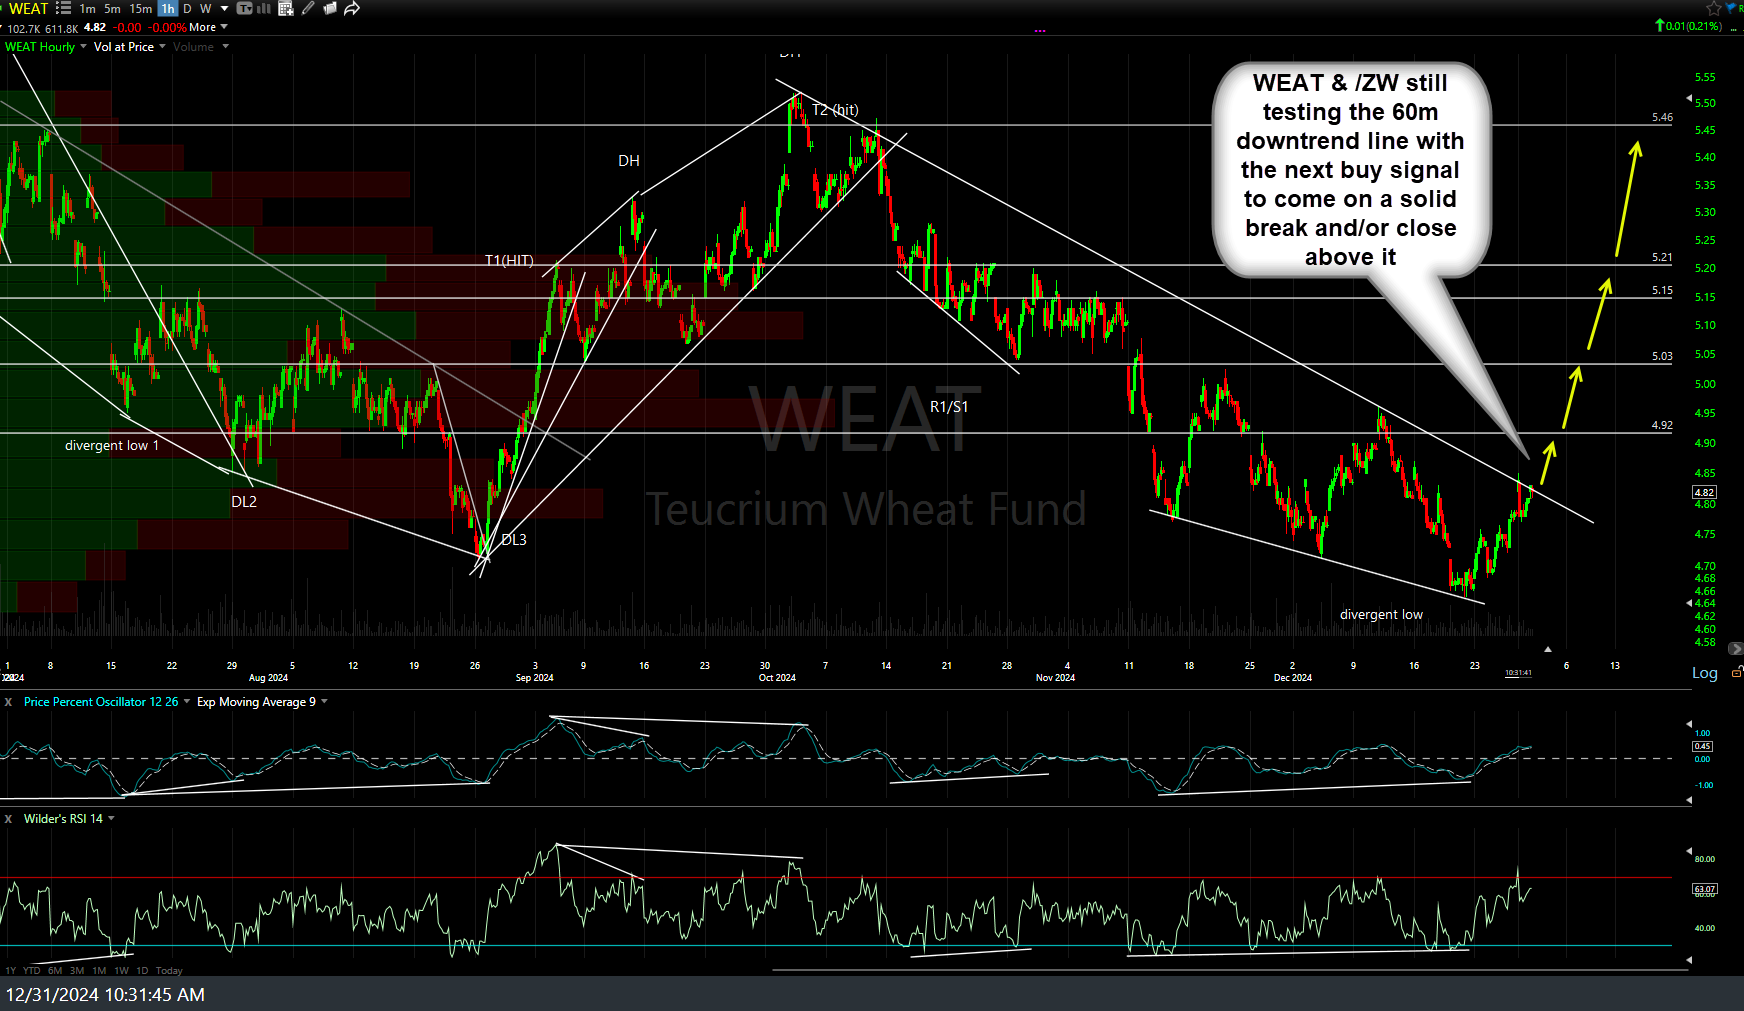
WEAT 60m Dec 31st
$WHEAT (continuous futures contract) is still a hair above this 25-yr long-term uptrend line with positive divergences continuing to build. Objective long entries still to come on either a breakout of the aforementioned downtrend lines (60m & daily charts) and/or any full tag of the primary long-term uptrend line in the weekly chart below.
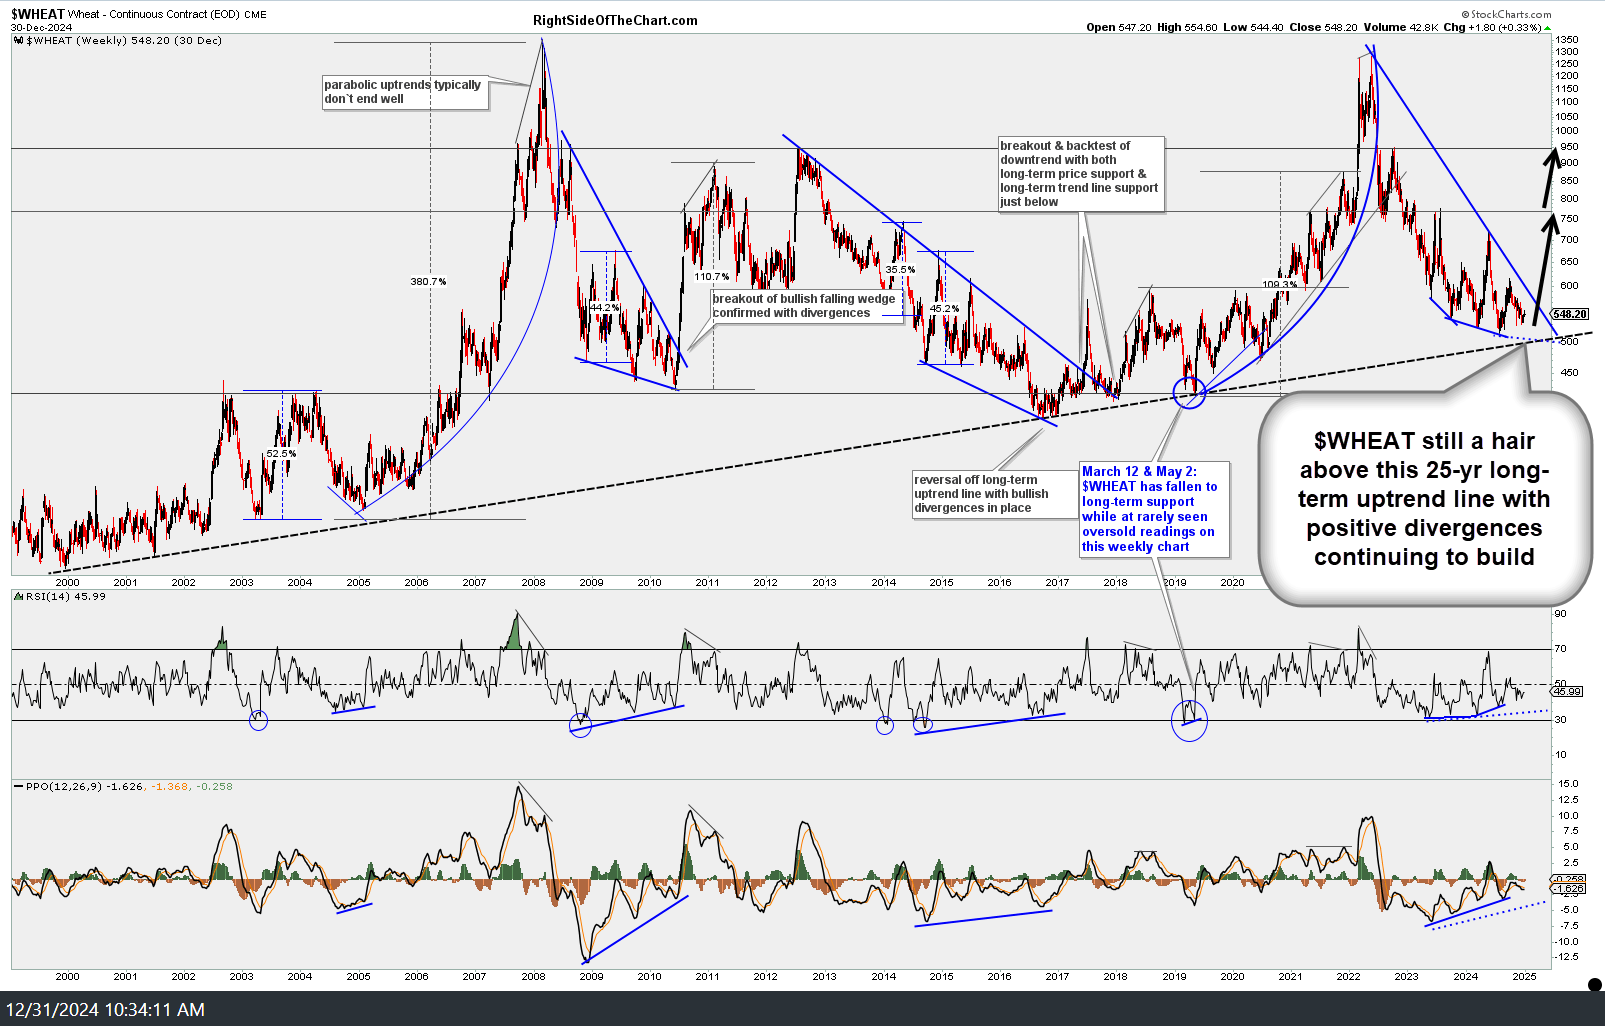
$WHEAT weekly Dec 31st
$NATGAS took out the top of my resistance zone yesterday, increasing the odds of the next leg up to my $5-ish target. As per yesterday’s video, any pullbacks, including down to the breakout level around 3.55 (Feb contract) and/or the bottom of Sunday’s night’s gap up around 3.65 (basically now, as /NG is trading at 3.675) offers an objective add-on, re-entry, or new long entry with stops commensurate with one’s average cost and preferred price target. Weekly chart below.
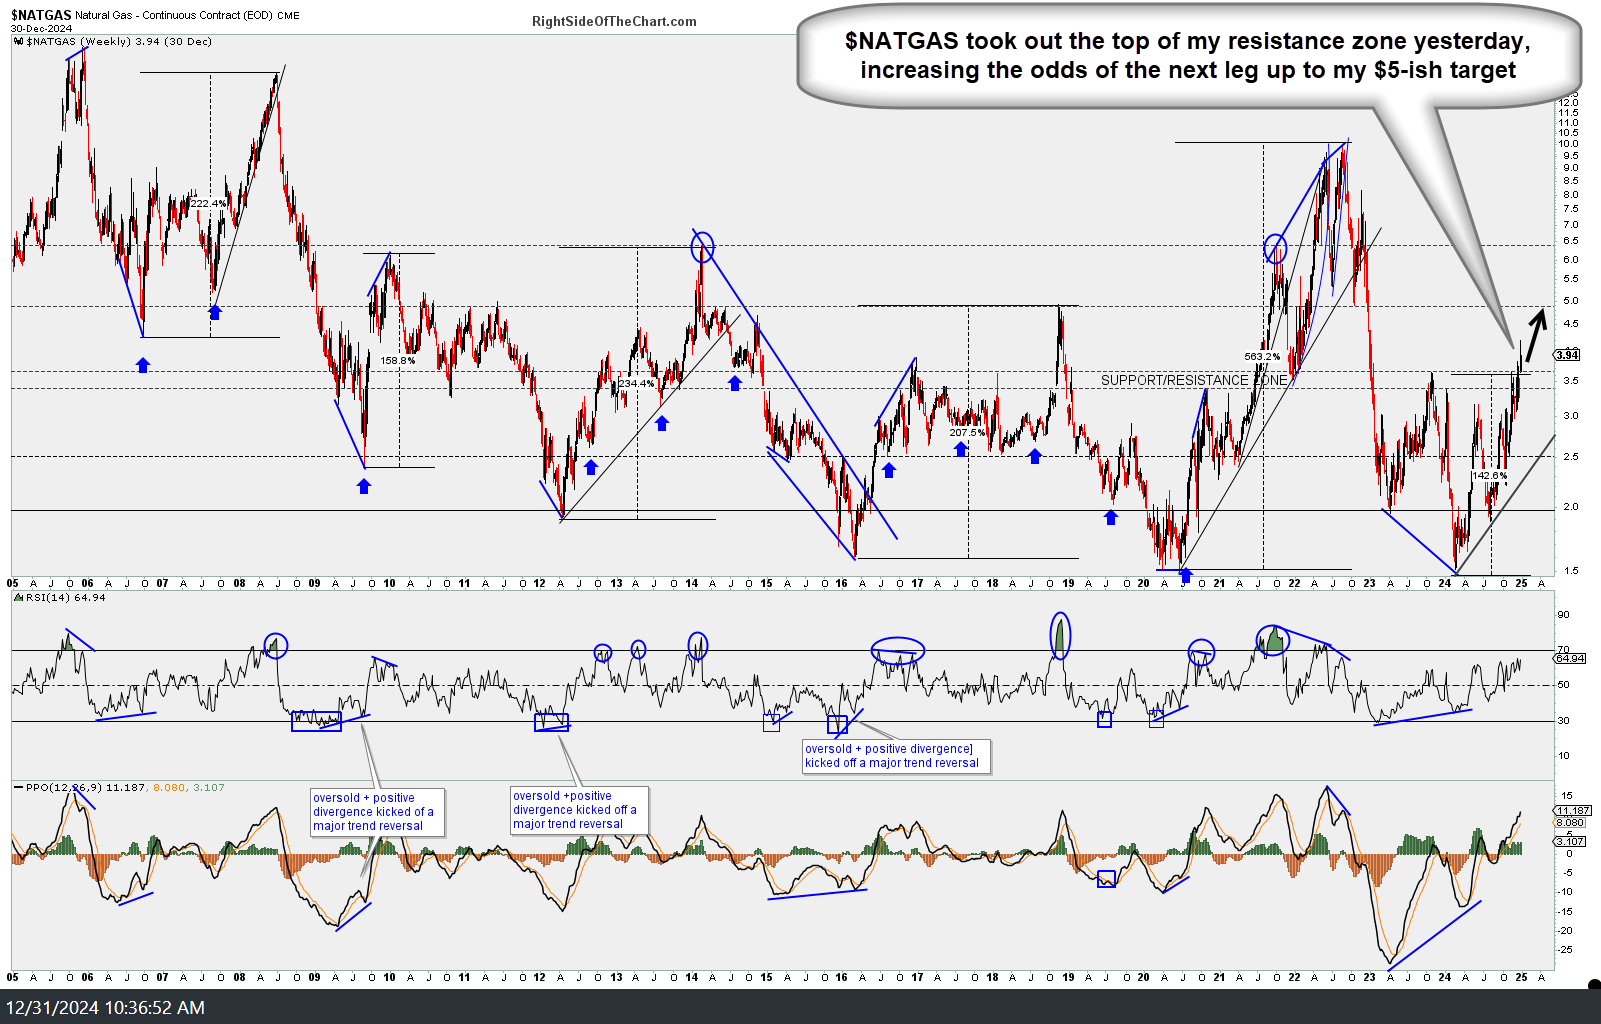
$NATGAS weekly Dec 31st