
As the equity markets basically closed around where they were trading during the recording of today’s Late Session Stock Market Analysis video, I figured that I’d post a few charts to monitor going forward.
QQQ closed on the 186ish resistance level/mid-point of the August trading range today & just shy of a backtest of the uptrend line off the early Aug lows. While I favor a reversal here (i.e.- a red close tomorrow) should it power through those resistance levels, the next significant resistance comes in around the top of the August trading ranges on both QQQ & SPY.
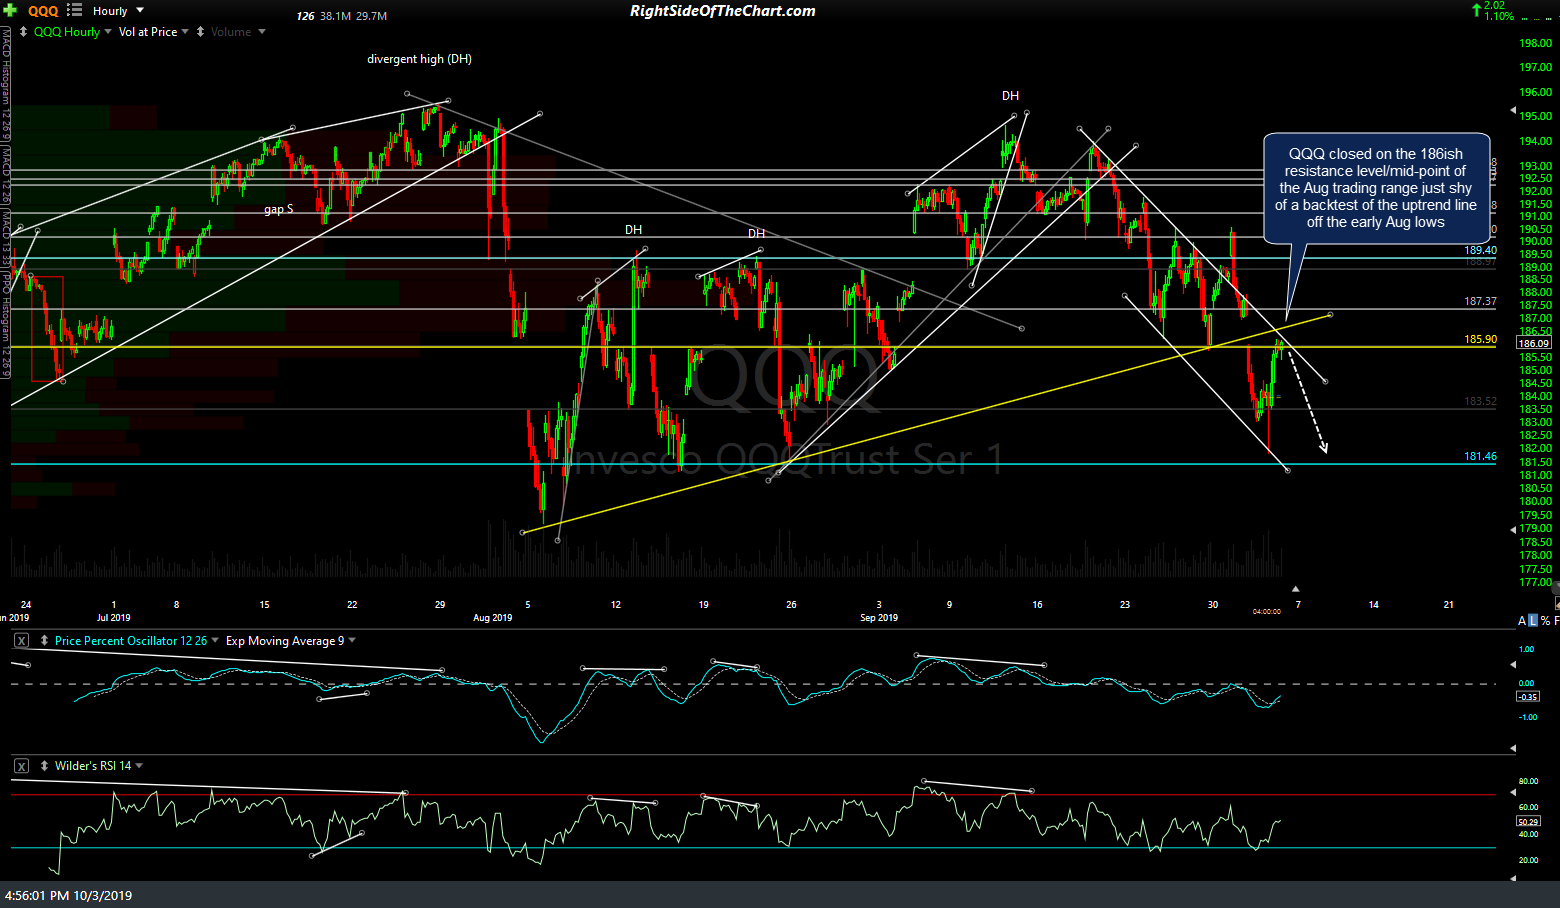
QQQ 60m 2 Oct 3rd
Despite the impressive intraday recovery & relatively strong 1.1% close in the tech-heavy Nasdaq 100, TLT rallied nearly 1% today which indicates that (generally speaking) the smart money wasn’t buying the stock market rally. However, as I like to say, one day does not make a trend and as such, this is something that I will continue to monitor tomorrow & into next week, should the stock market build on today’s gains.
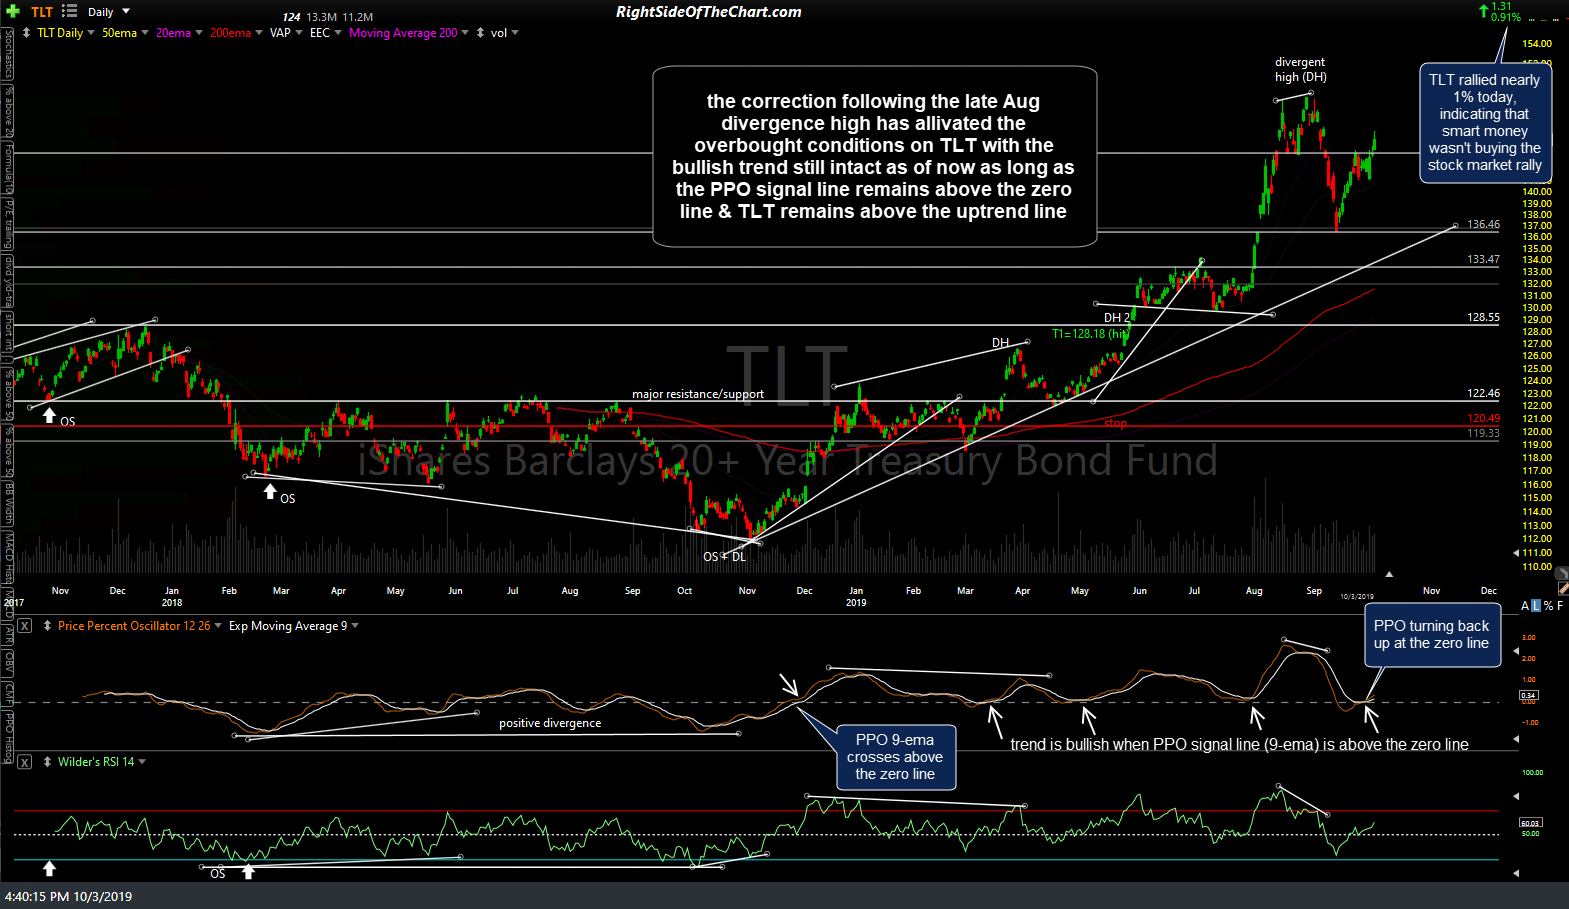
TLT daily Oct 3rd
Should the stock market make another run at new highs, GLD would likely fail after or before backtesting the primary uptrend line while a continuation of the current correction in the stock market will likely spark the next leg higher in gold. As with TLT, the PPO is starting to turn back up at the zero line with the trend bullish when the PPO signal line (9-ema) is above the zero line, bearish when below.
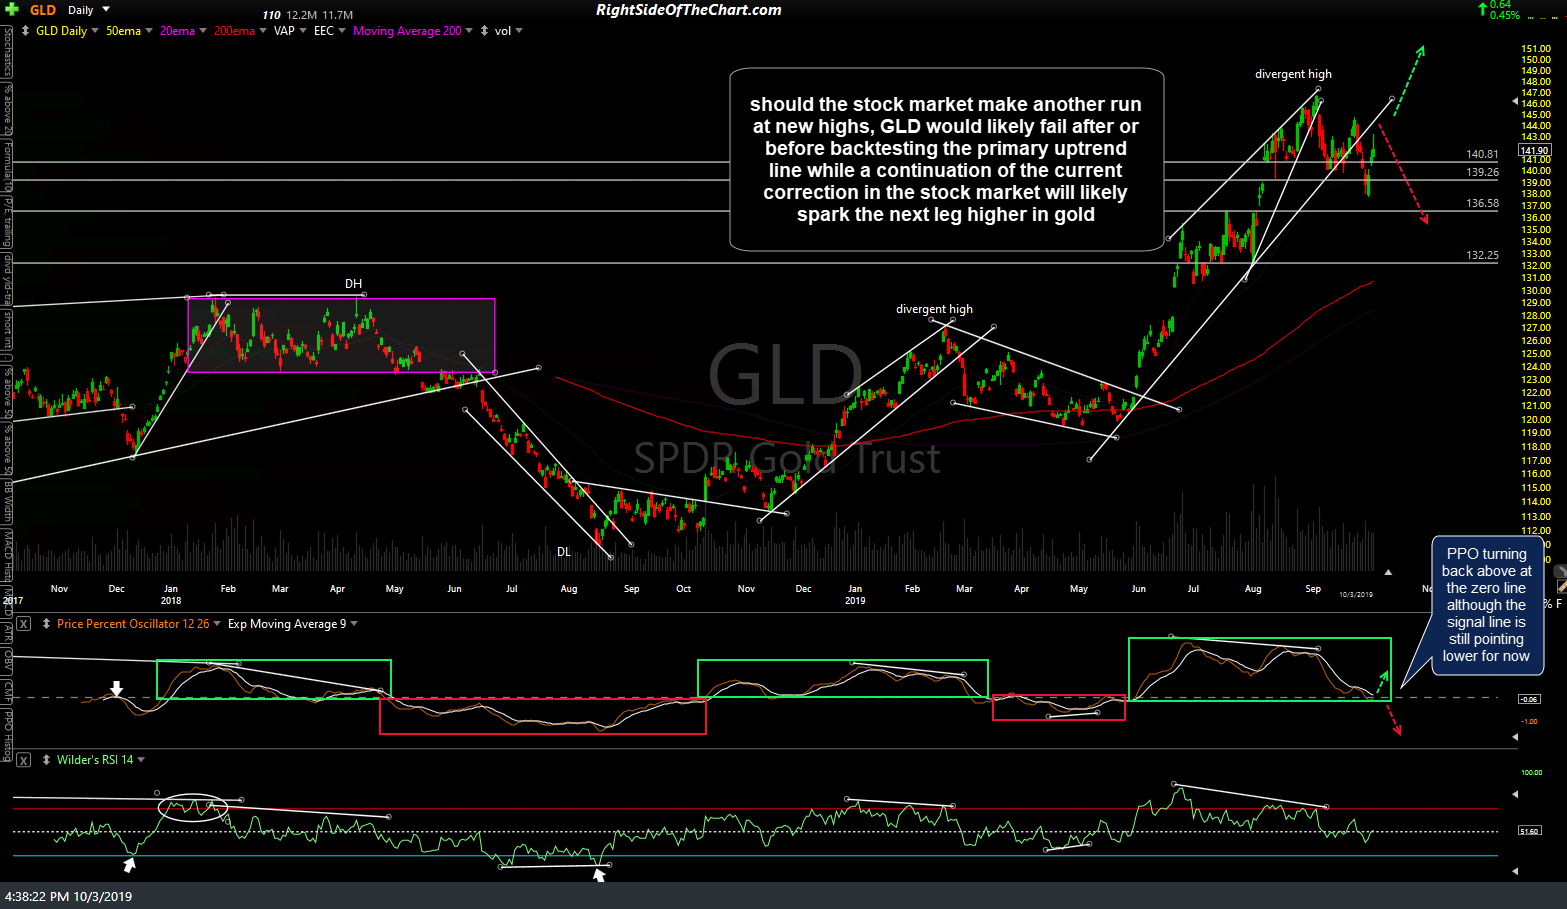
GLD daily Oct 3rd
It would be bullish if GLD can climb back well-above this recently broken uptrend line & especially above the previous highs. Until then, it remains in a near-term bearish technical posture following the recent divergent high & breakdown. 120-minute chart below.
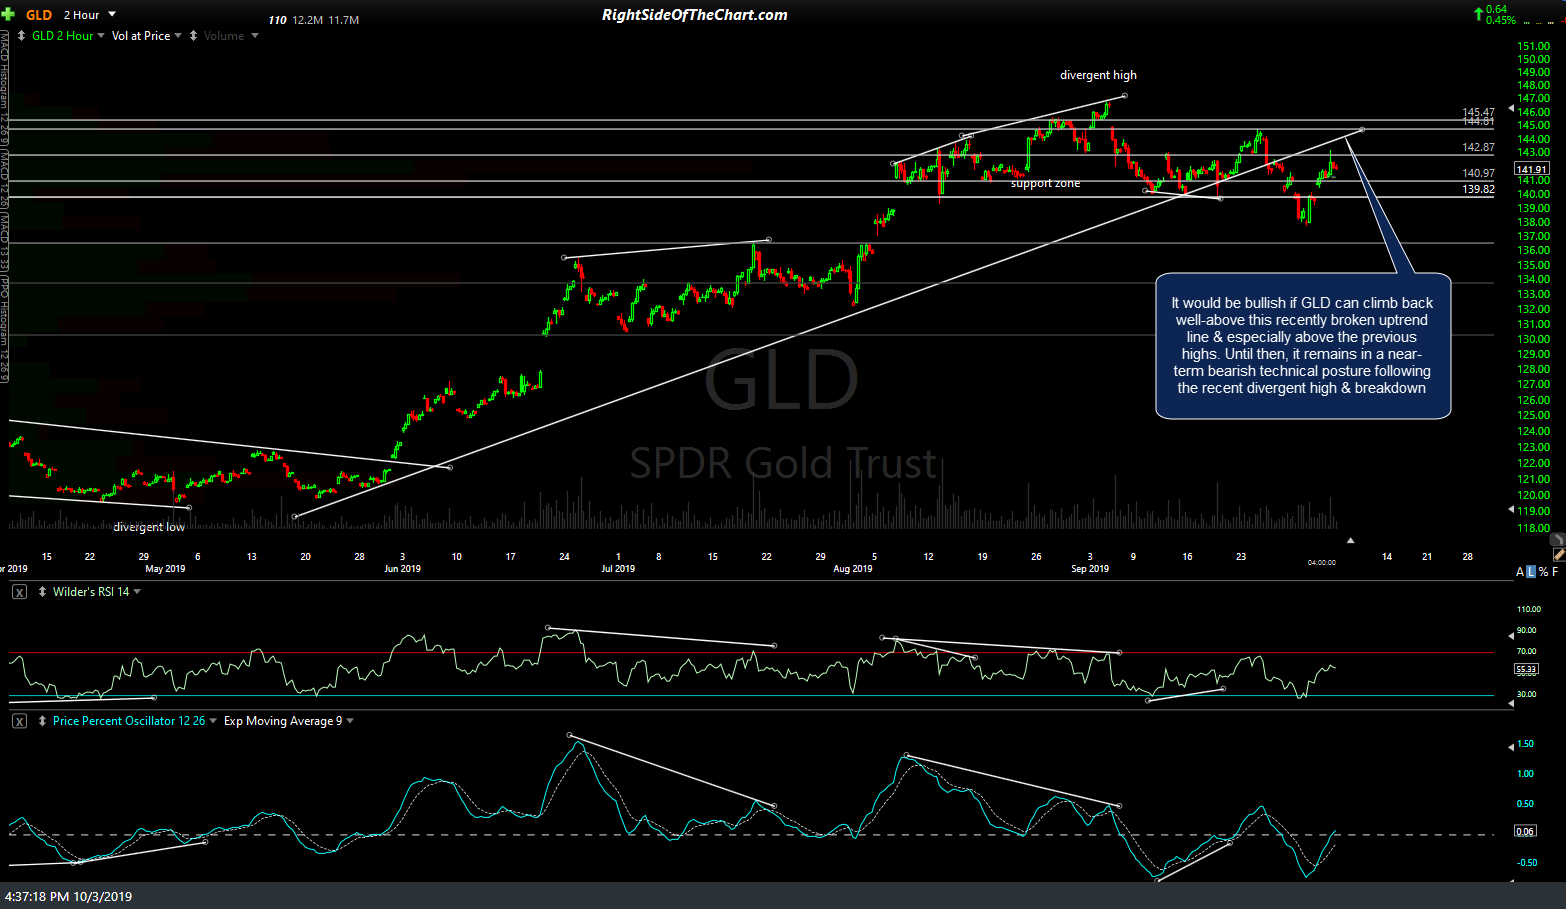
GLD 120m Oct 3rd
/GC (gold futures) recently put in a small divergent high with a potential near-term high within the rising price channel on the 60-minute chart below. Should the equity market rally substantially tomorrow, that would likely trigger at least a near-term correction in /GC with a sell signal to come on a break and/or 60-minute close below the price channel.
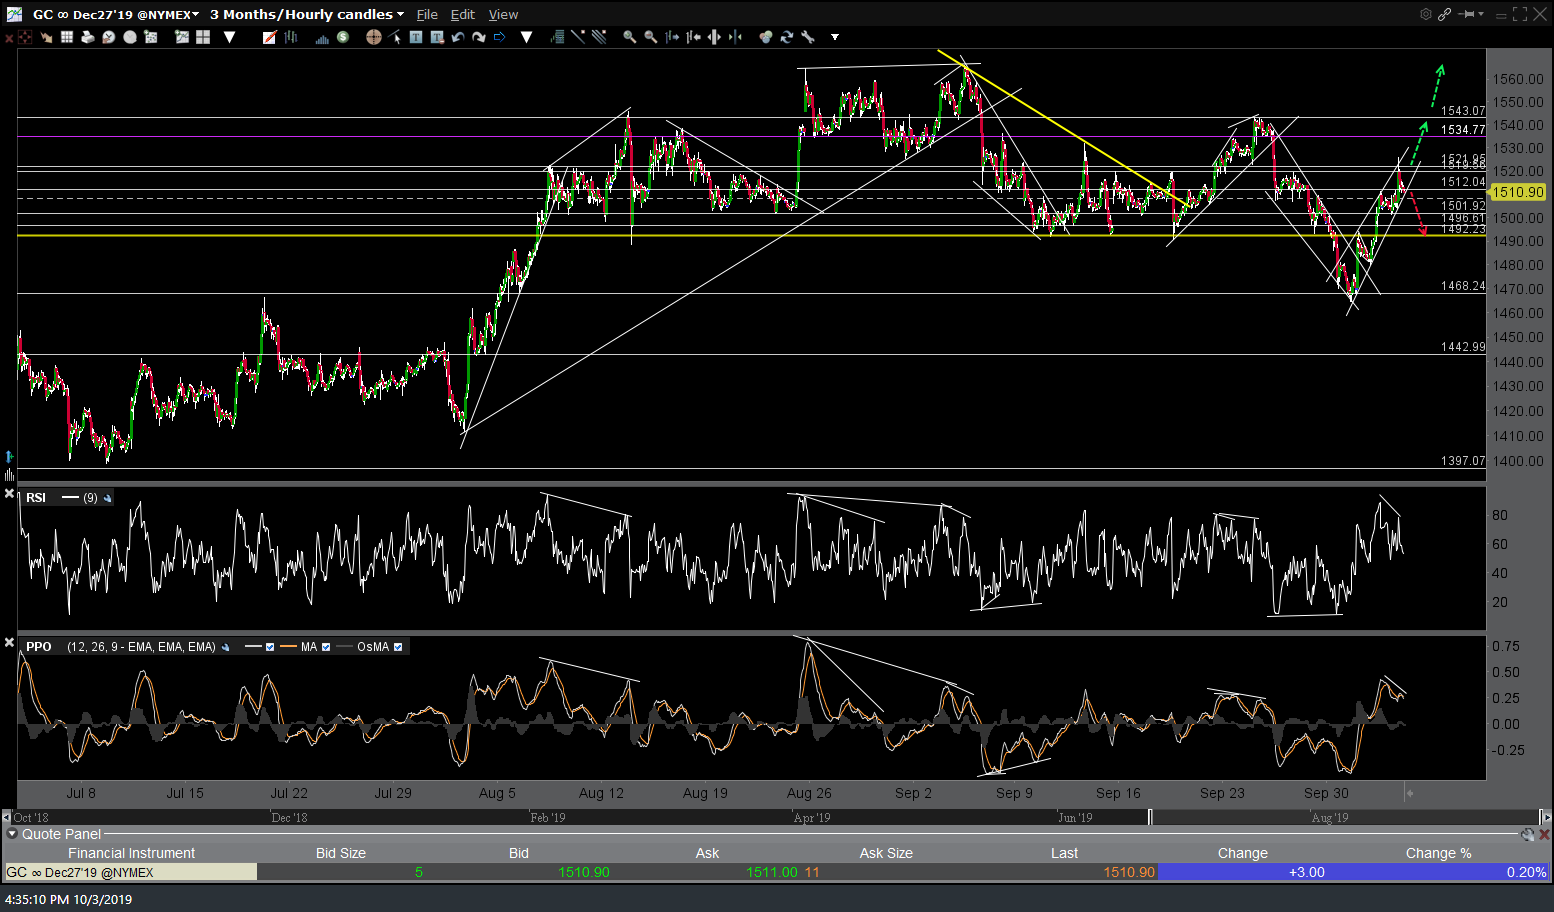
GC 60m Oct 3rd