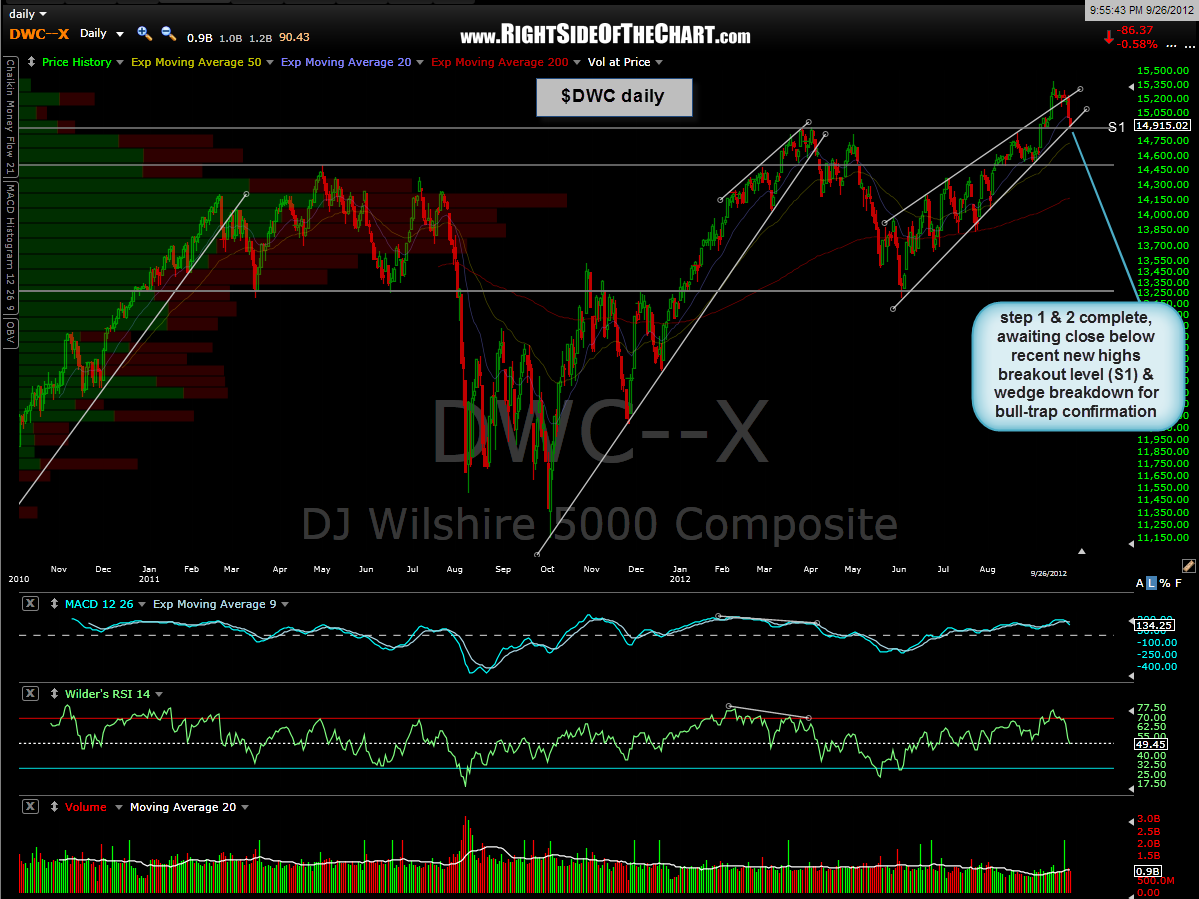
here’s a few of the recently highlighted key indices and where we stand as far as my primary scenario goes. this first chart is the Wilshire 5000 ($DWC). prices closed right on both the key support level that marked the recent breakout to new highs as well as the bottom of the bearish rising wedge. any close or solid intraday break below this level will leave a lot of trapped buyers who chased the recent “bullish” breakout to new highs and will be underwater on their positions.
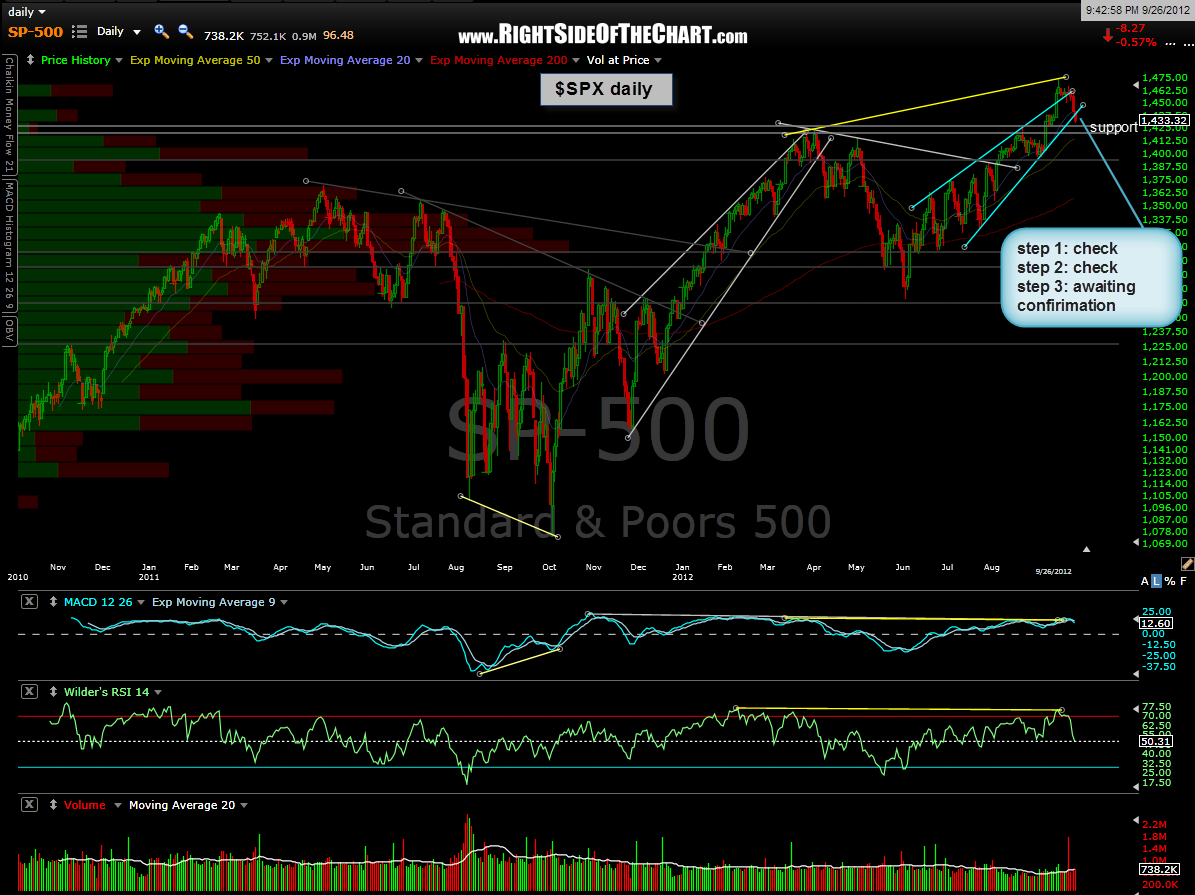
this next chart below is the S&P 500 ($SPX) which shows that prices closed slightly below the wedge, following the previous wedge overthrown and sharp move back inside the wedge. prices now remain just above the level where they recently broke out to new highs. a solid move back below that level would help affirm the bearish case and increase the odds of additional downside in the market. as the chart of the QQQ ($NDX tracking etf) below shows, prices have clearly and impulsively moved back below the level where the index broke out to new highs, clearly a bearish technical event for the leading index. the $NDX/QQQ remains my preferred index/etf for those who prefer to short broad based index etf’s vs. individual stocks. please note that i have slightly revised my downside price targets from those previously posted on the 4-hour QQQ charts. those targets are listed on the daily chart below.
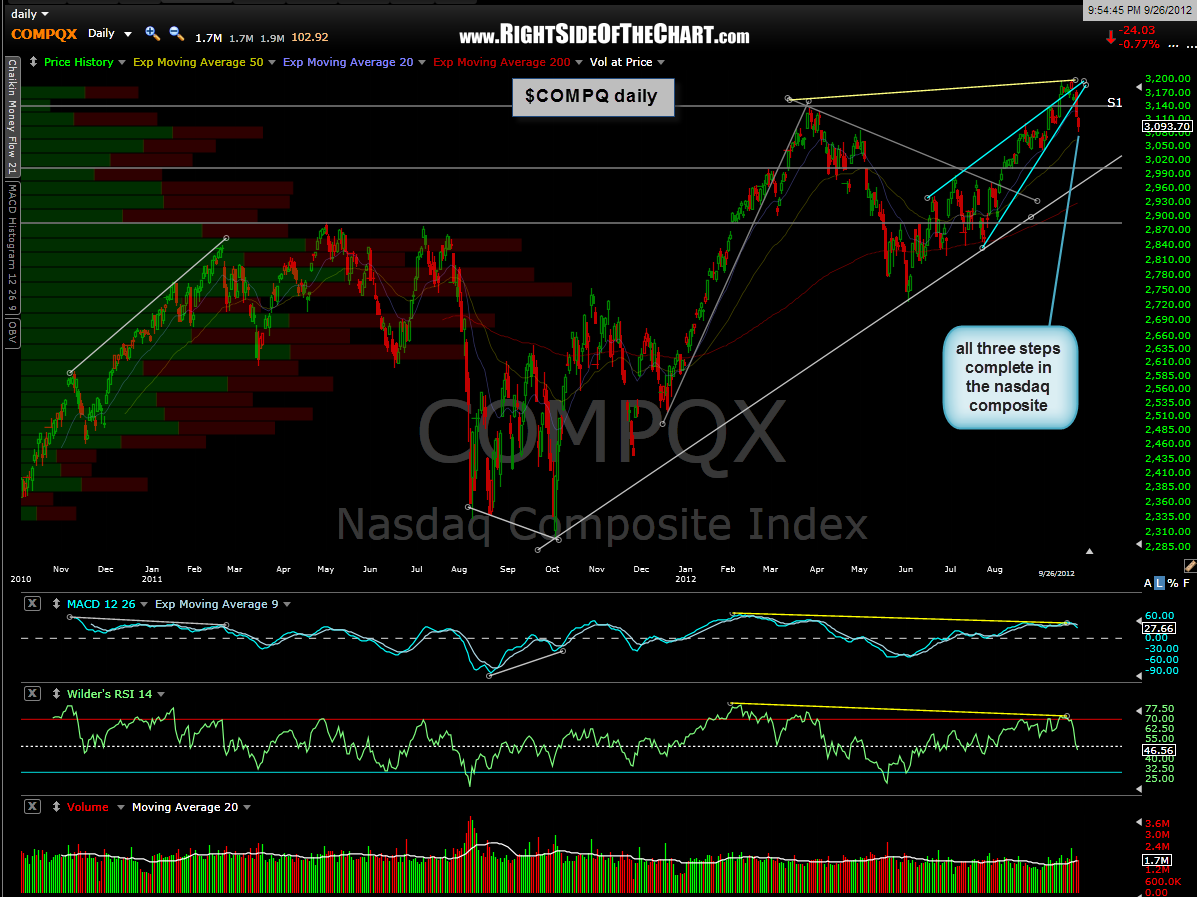
finally, the Nasdaq Composite ($COMPQ) has met all three of the previously discussed bull-trap criteria for many of the major indices following it’s wedge overthrow: 1) prices fell back into the wedge 2) then quickly continued lower, causing a downside breakout of the rising wedge pattern and 3) prices continued to move down impulsively, falling back well below the recent breakout to new highs.
bottom line: most, but not all of the major indices have triggered all the necessary criteria for a potentially powerful bull-trap. with most sentiment measures such as the $VIX, put-call ratio, bull/bear surveys, fund manager equity allocation percentages, etc… at or near extreme complacency levels for some time now, all of the ingredients are in place for a very sharp and potentially long lasting sell-off in equities. first things first though and that would be to see these remaining indexes break below the recent new-highs breakout levels. let’s also see how the big economic reports come in tomorrow, although regardless of any upside surprises, the US macro-economic picture has been trending lower roughly since the US market’s previous peak back in early april. finally, in regards to those reports tomorrow and any upcoming economic or other fundamental data that come out; it’s not always whether the data is better or worse than expected, more so how the market reacts following it’s release. for example, if we get an upside surprise on GDP, causing a big gap higher in stocks tomorrow, whether or not the market can hold onto and build on those gains into the weekend and early next week (or not) should be very telling.

