
As we head into the final full trading day of the week (the US stock market is closed tomorrow with an abbreviated 1 pm close on Friday), here are a few of the charts that I’m watching.
SPY continues to chop around near the top of the multi-month trading range with the negative divergences still well intact on the daily time frame. Any marginal new highs any time soon with still be a divergent high.

SPY daily Nov 25th
QQQ continues to grind around within a multi-month trading range while any marginal new high soon (likely) will still be a divergent high, increasing the odds of a significant trend reversal after the divergences are confirmed. Daily chart below.

QQQ daily Nov 25th
While the recent dash-for-trash (rallies in the smaller, lower-quality stocks vs. large-caps) continues, at least through yesterday, IWM has put in another divergent high on this 60-minute time frame with a sell signal pending a break of the uptrend line & a likely pullback target of 165.20ish.
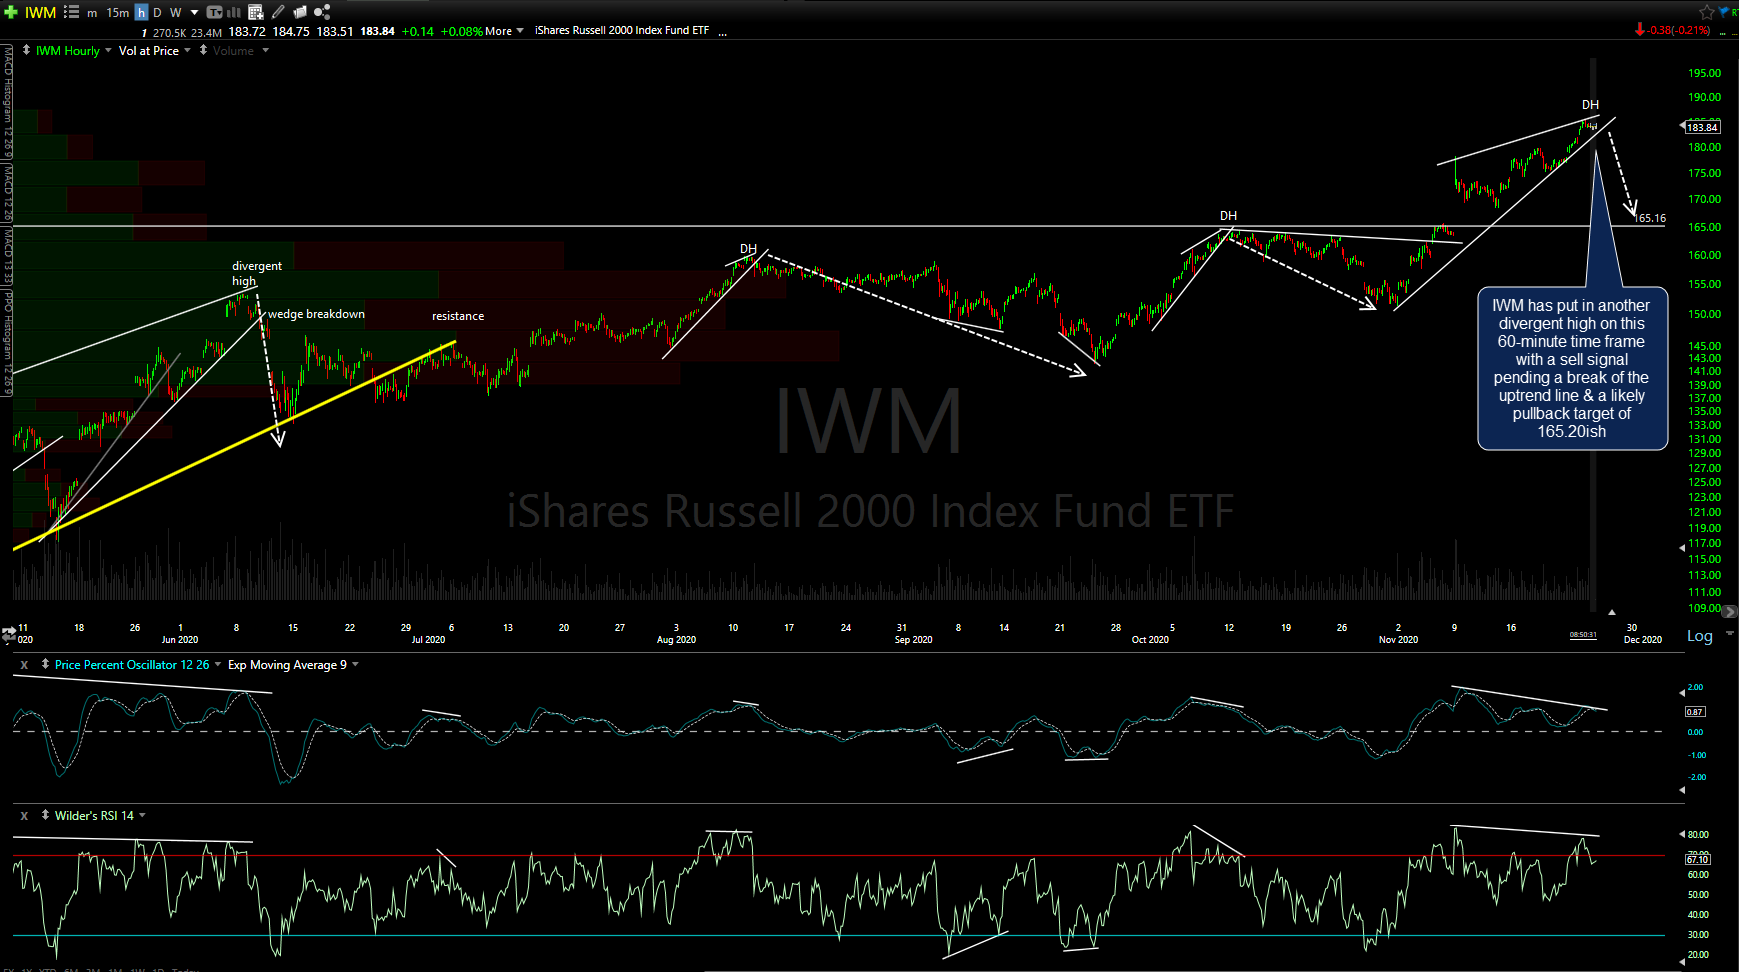
IWM 60m Nov 25th
/NQ (Nasdaq 100 futures) made an impulsive breakout above the 60-minute downtrend with /NQ currently trading at the 12117 resistance level following a brief momo-fueled overshoot. I’d been leaning towards a marginal new (all-time) high in the indexes for a while and while we did get that on the S&P 500, the tech-heavy Nasdaq 100 has yet to do so although it is in spitting distance now (less than 3%). Whether or not the $NDX puts in new highs soon or not, the R/R for new long positions in either large-cap index does not appear favorable at this time due to the technical posture of both the $SPX & $NDX.
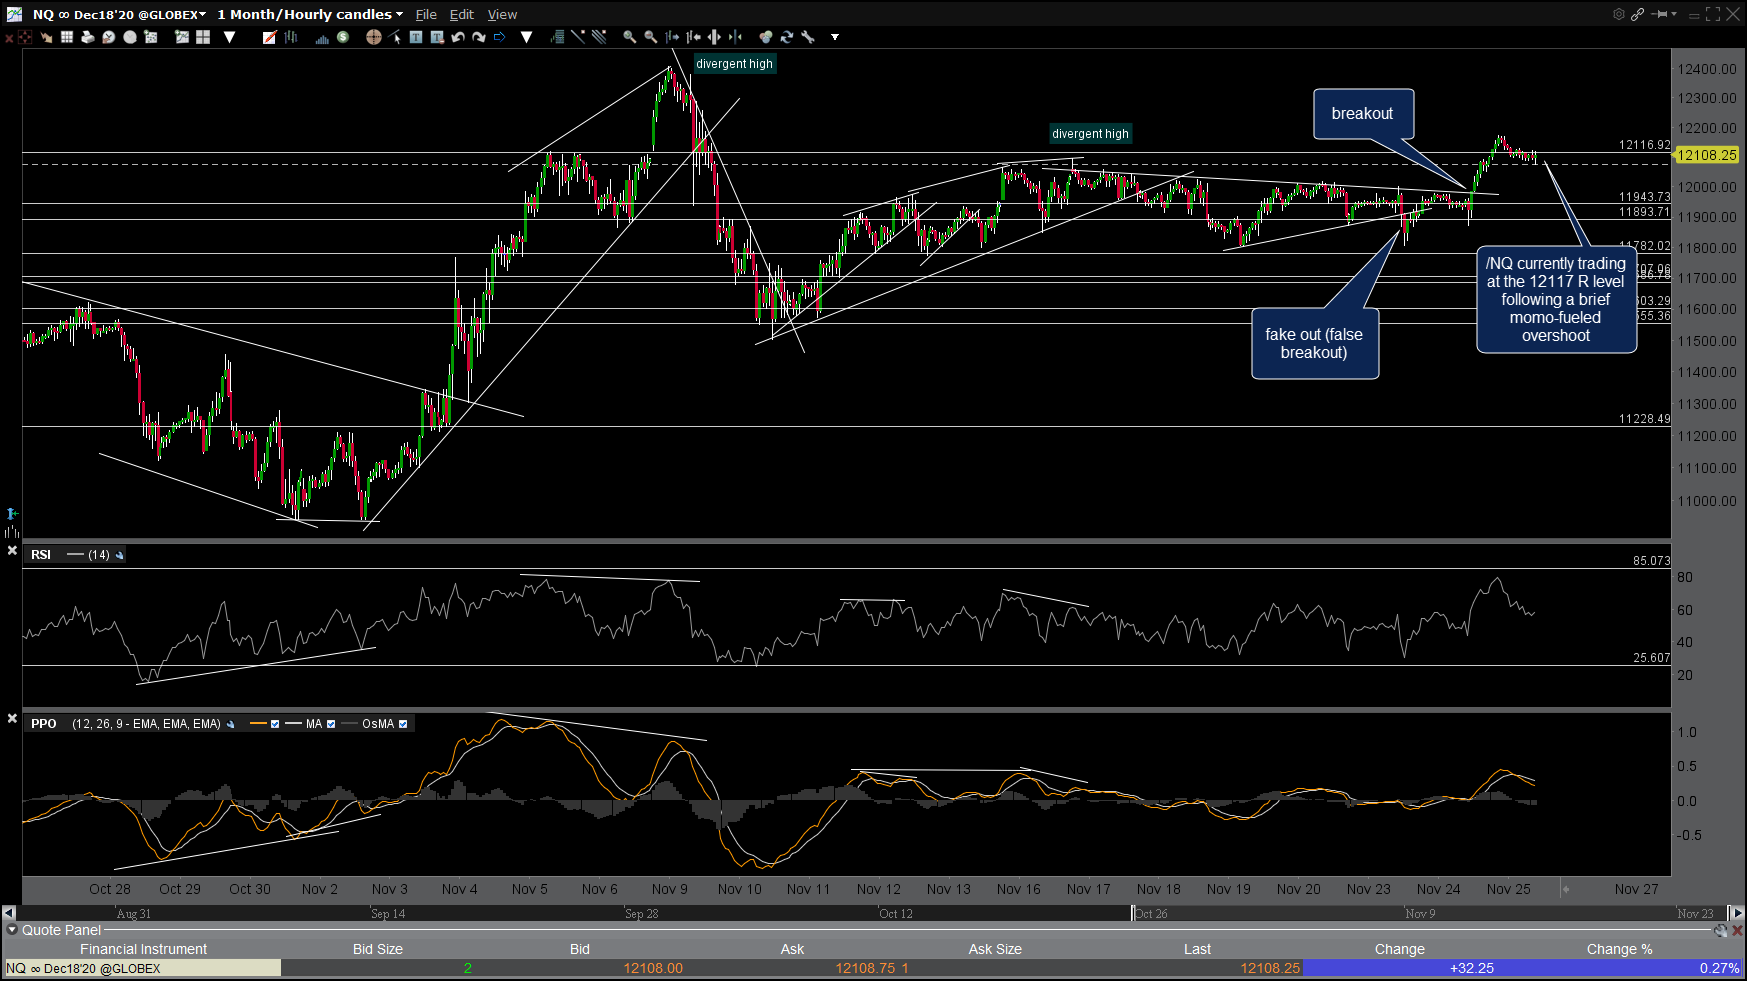
NQ 60m Nov 25th
/KC coffee held & reversed off the 1.1585 support level & is currently backtesting the trendline + 1.1896 resistance level from below: Bullish if it can solidly pop back above, bearish if /KC drops much below 1.1585. 120-minute chart below.
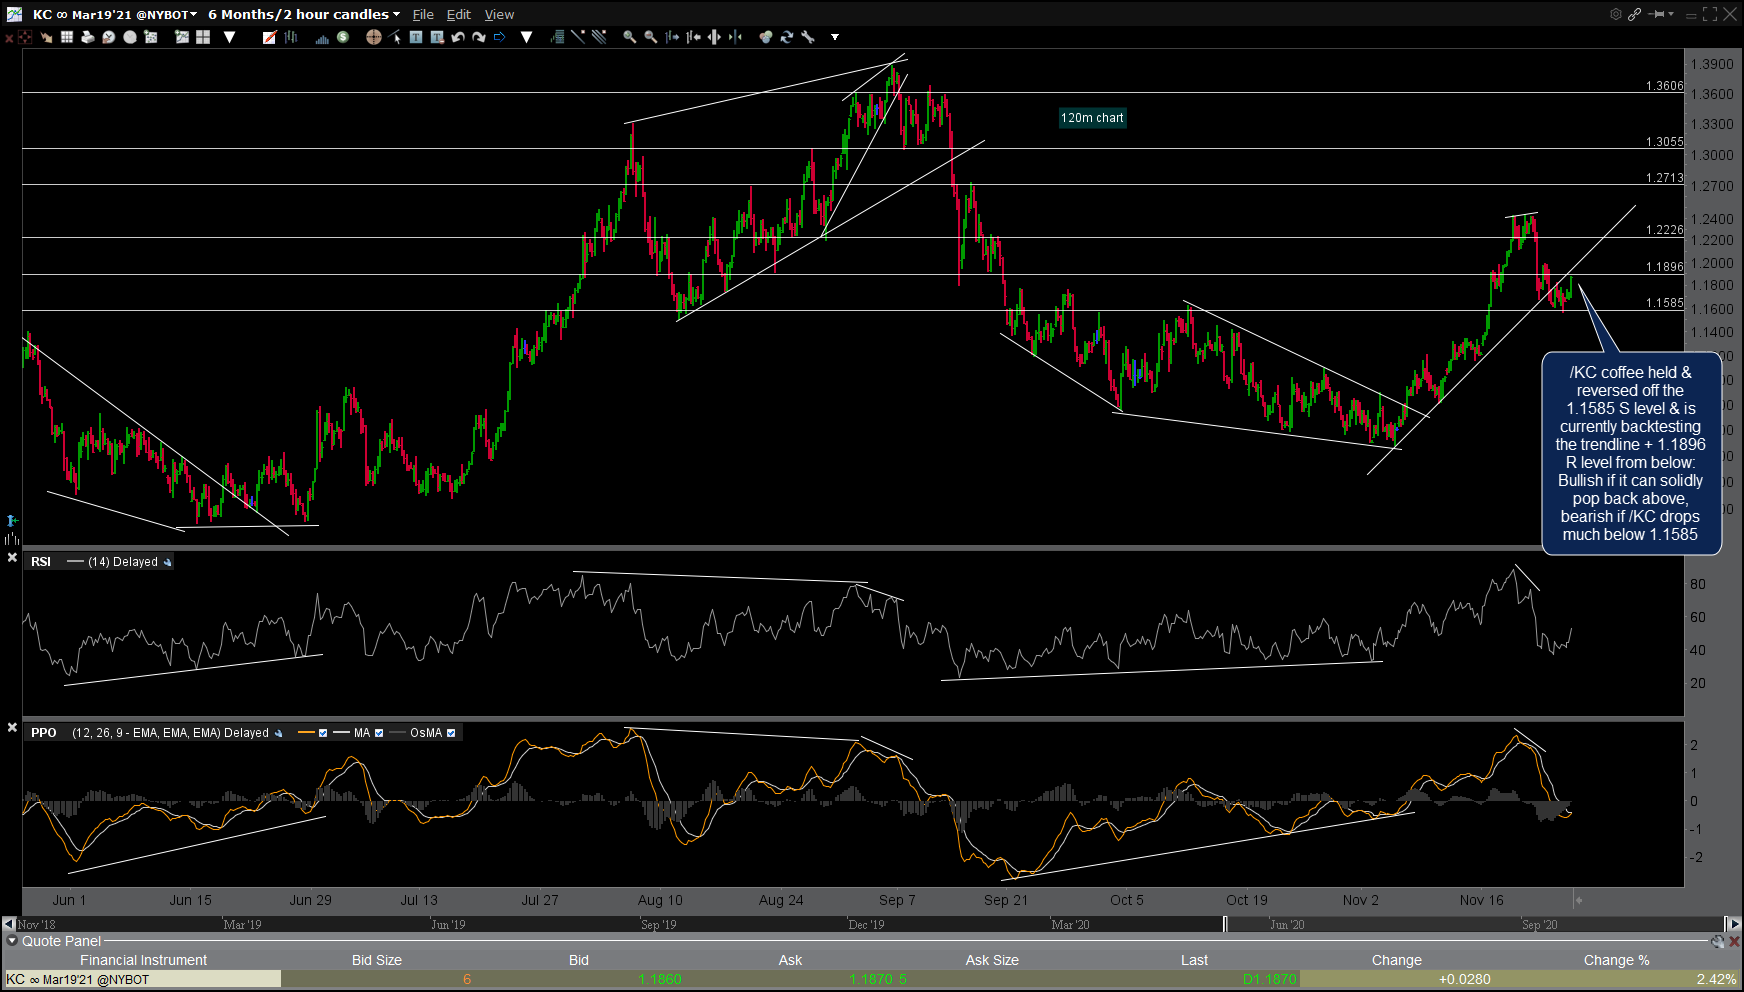
KC 120m Nov 25th
Bottom line: The best swing trading opportunities continue to be found in the smaller, non-indexes stocks that have been highlighted in the various trade ideas videos over the past couple of months as the large-cap indexes continue to grind around. Although both the $SPX & $NDX are near all-time highs, the technical posture of both indicates that any new highs soon may prove to just be marginal new highs with the potential to mark significant highs before the next correction until & unless the divergences are taken out.
I’ll be taking the rest of the day off, returning to my desk later today, possibly before the market close. Best of luck with your trades & a safe & happy Thanksgiving! -rp