
A Fed-induced major reversal in /DX ($USD) appears likely & imminent as the current trajectory in the $USD & Treasury bonds is unsustainable & is starting to pose a systemic risk to the global financial markets. Arrow breaks denote longer-term price targets for /DX although we are still awaiting a decent sell signal with no signs of a reversal at this time. Daily chart of /DX (US Dollar futures) below.
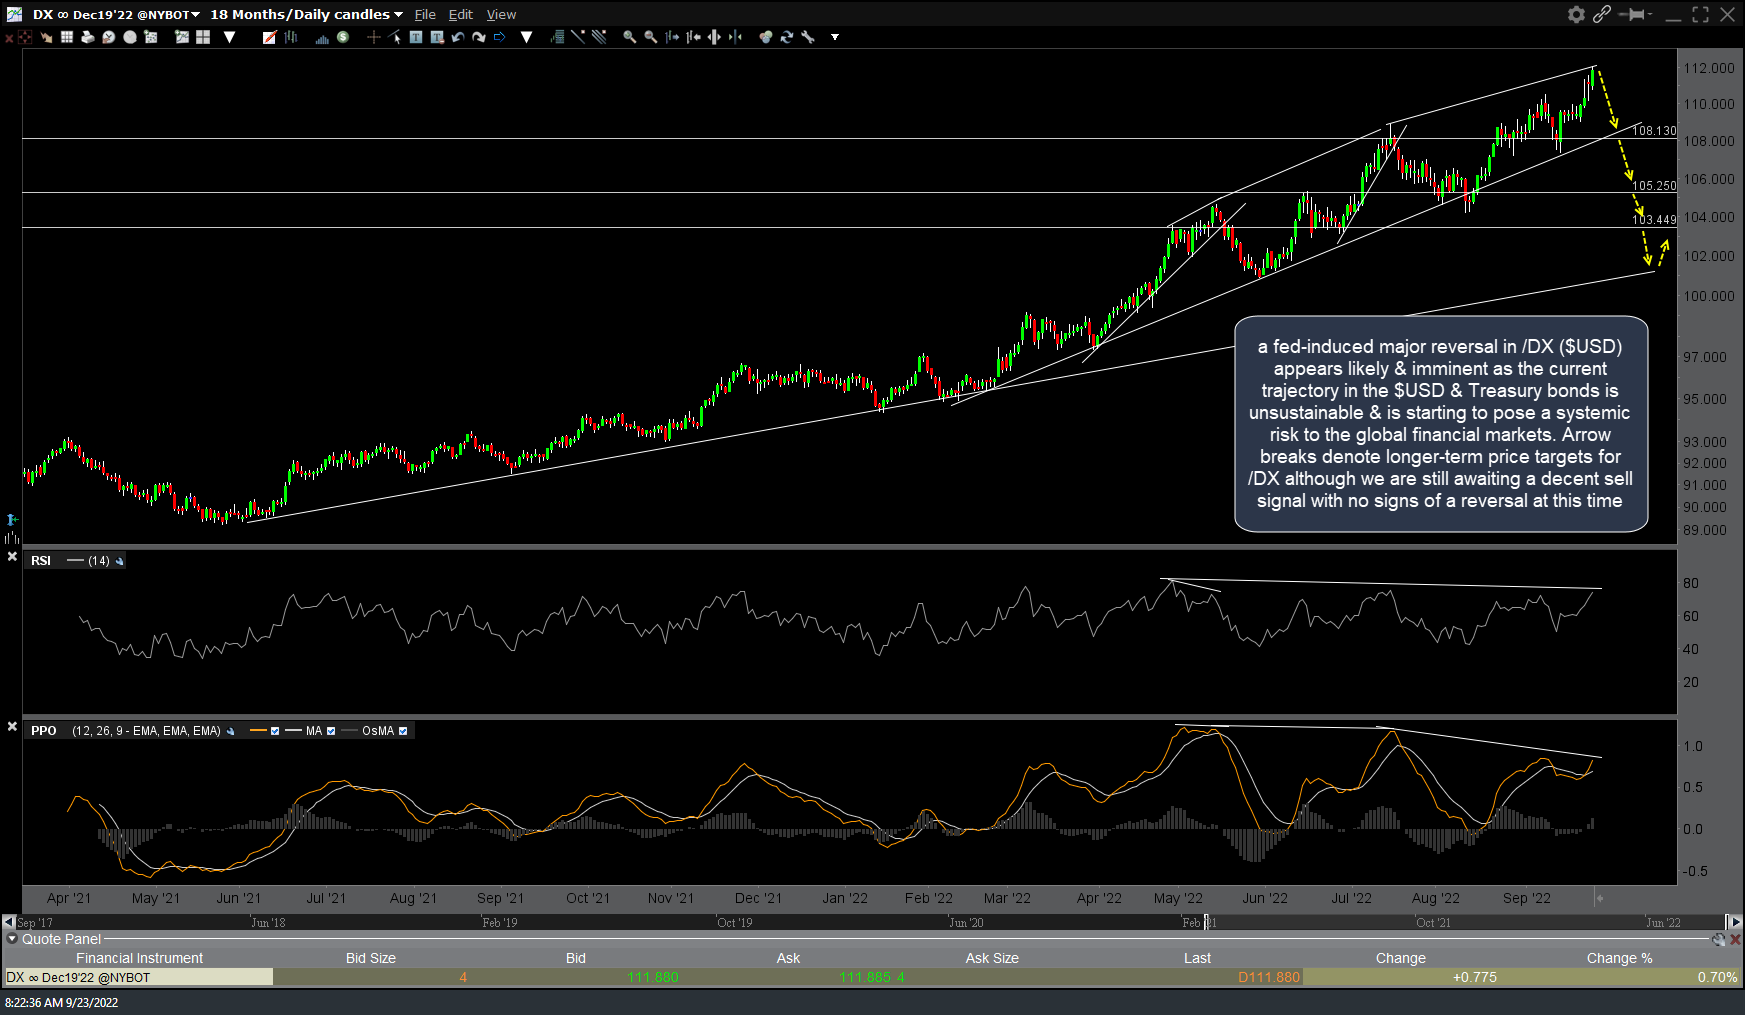
DX daily Sept 23rd
With a Fed-induced reversal in the $USD likely imminent at this time, the 60-minute chart of /DX below has some near-term pullback targets at the arrow breaks with a sell signal to come on a break below the minor uptrend line and/or any decent candlestick reversal patterns.

DX 60m Sept 23rd
I’m expecting the next “Powell Pivot” any day now, quite possibly as soon as today (he is scheduled to speak later today) with an explosive reversal in long-term Treasury bonds to follow. This channel overshoot could be the start of a selling climax on the 30-yr T-bond futures (/ZB). 120-minute chart below.
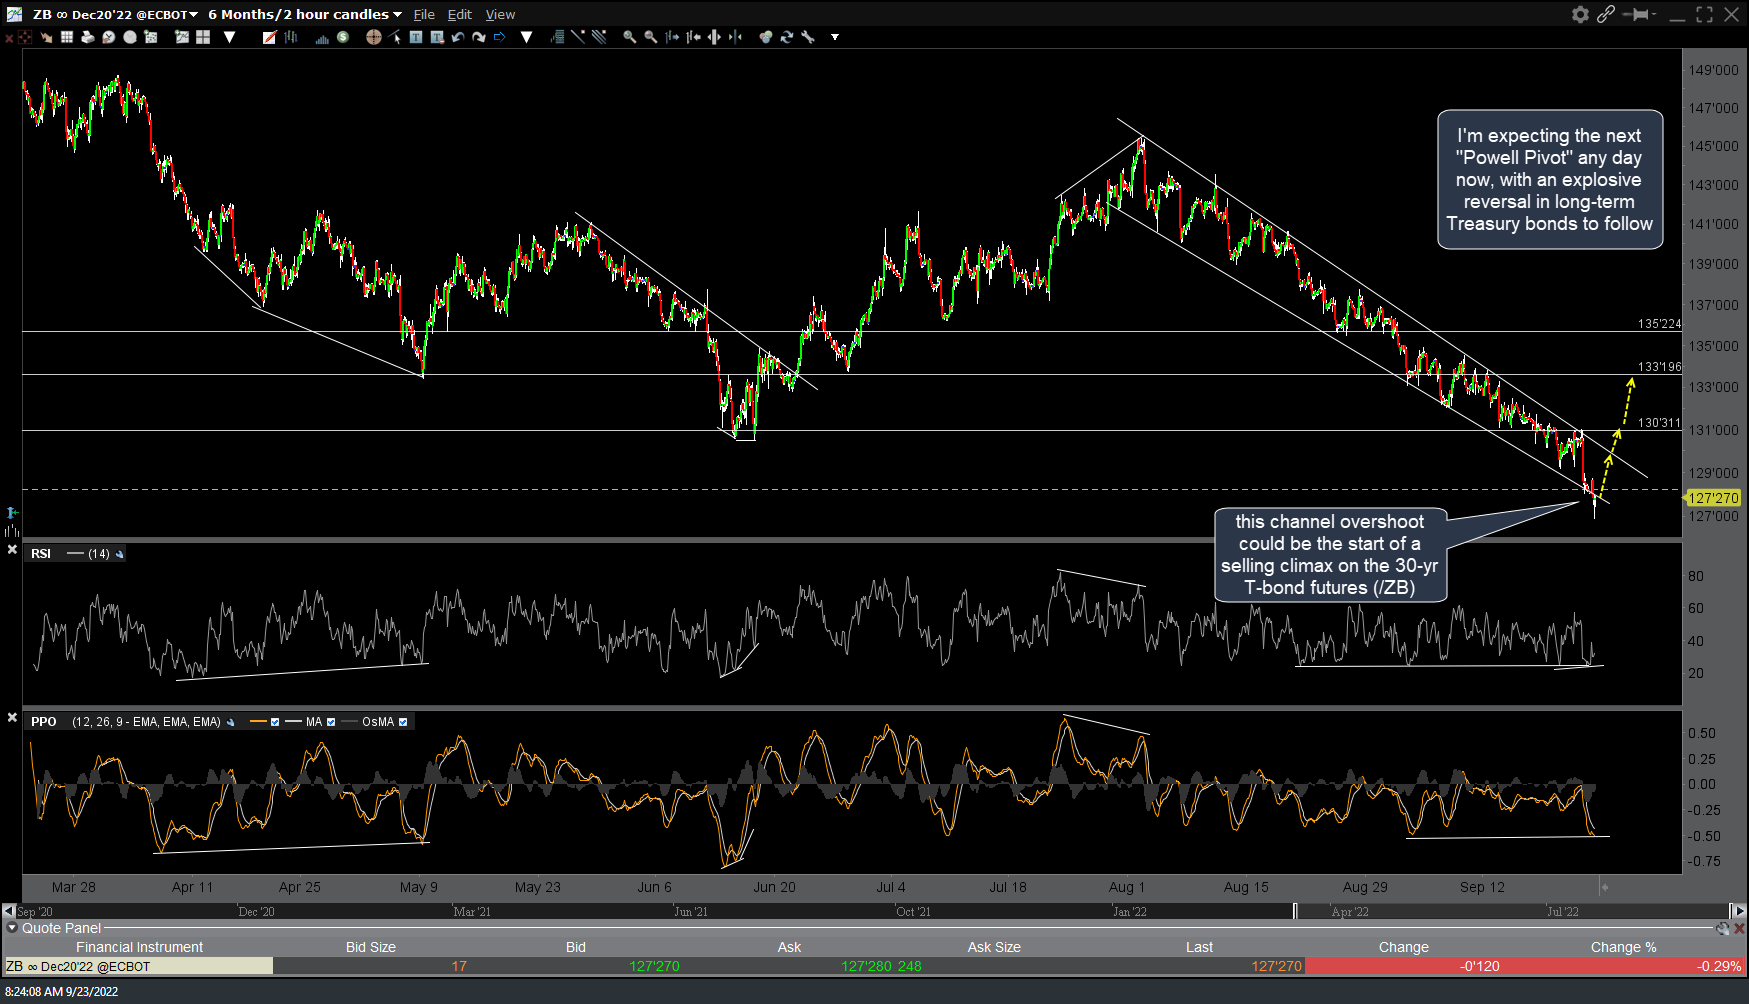
ZB 120m Sept 23rd
And before I get the question in the comment section below this post: No, I am not covering my index shorts at this time but will assess the charts & price action if/when the market reacts to any potential pivot from the Fed and/or other central banks. As of now, I still prefer a continued move down to at least T4 on the QQQ weekly chart (235ish area) in the coming days to weeks.