
The day is still young & with whipsaws more than common in the Fed-induced rally following the-Feb-March ‘Rona-induced rout in the stock market, anything is possible but as of now, it appears that all of the major stock index futures have made impulsive breakouts above potential bull flag continuation patterns which formed overnight. The potential bull flag continuation pattern on /NQ (Nasdaq 100) has a measured target (show by the yellow arrow) projecting a rally up to the 61.8% Fib & backtest of the primary uptrend line, which aligns with the top of my preferred bounce target zone posted yesterday.

NQ 60m Sept 10th
/ES (S&P 500) has also broken above what appears to be a potential bull flag continuation pattern on the 60-minute time frame which roughly aligns with the top of my bounce target zone of 2447-3482 & the aligning 50%-61/8% Fibonacci retracement levels.
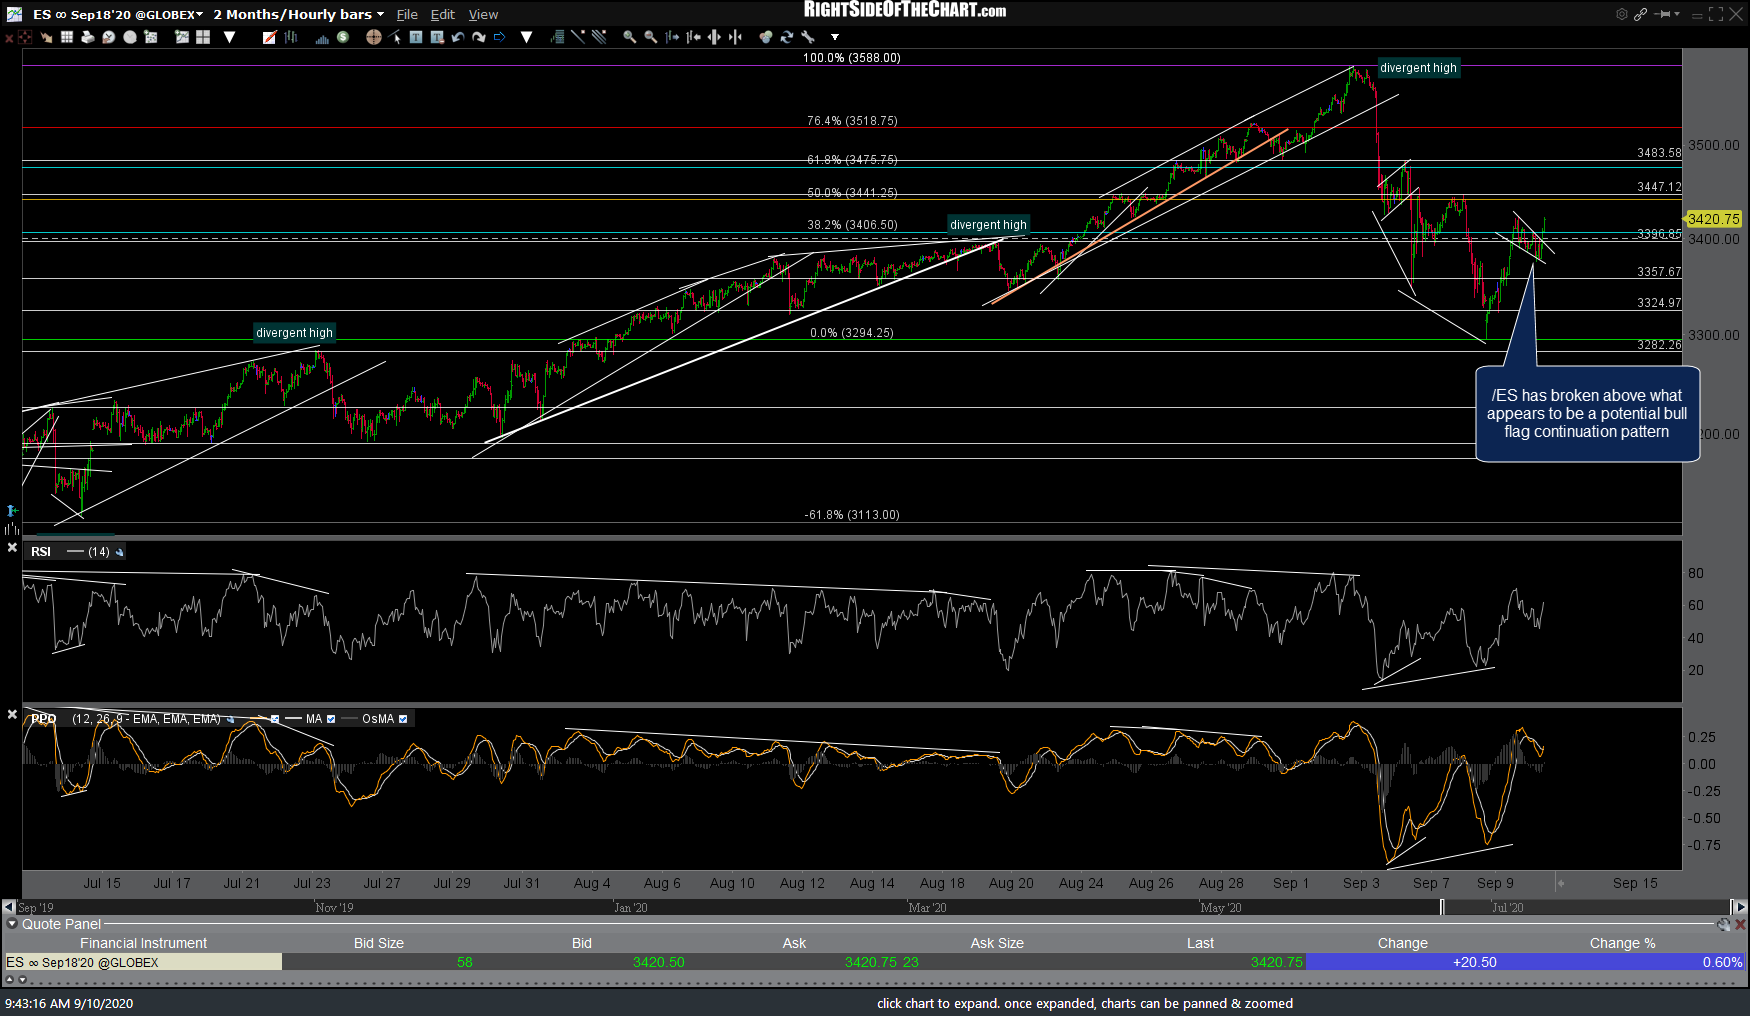
ES 60m Sept 10th
/RTY (Russell 2000 Small-cap Index) has broken above a potential bull flag continuation pattern as well with a measured target around the 1555 resistance level.
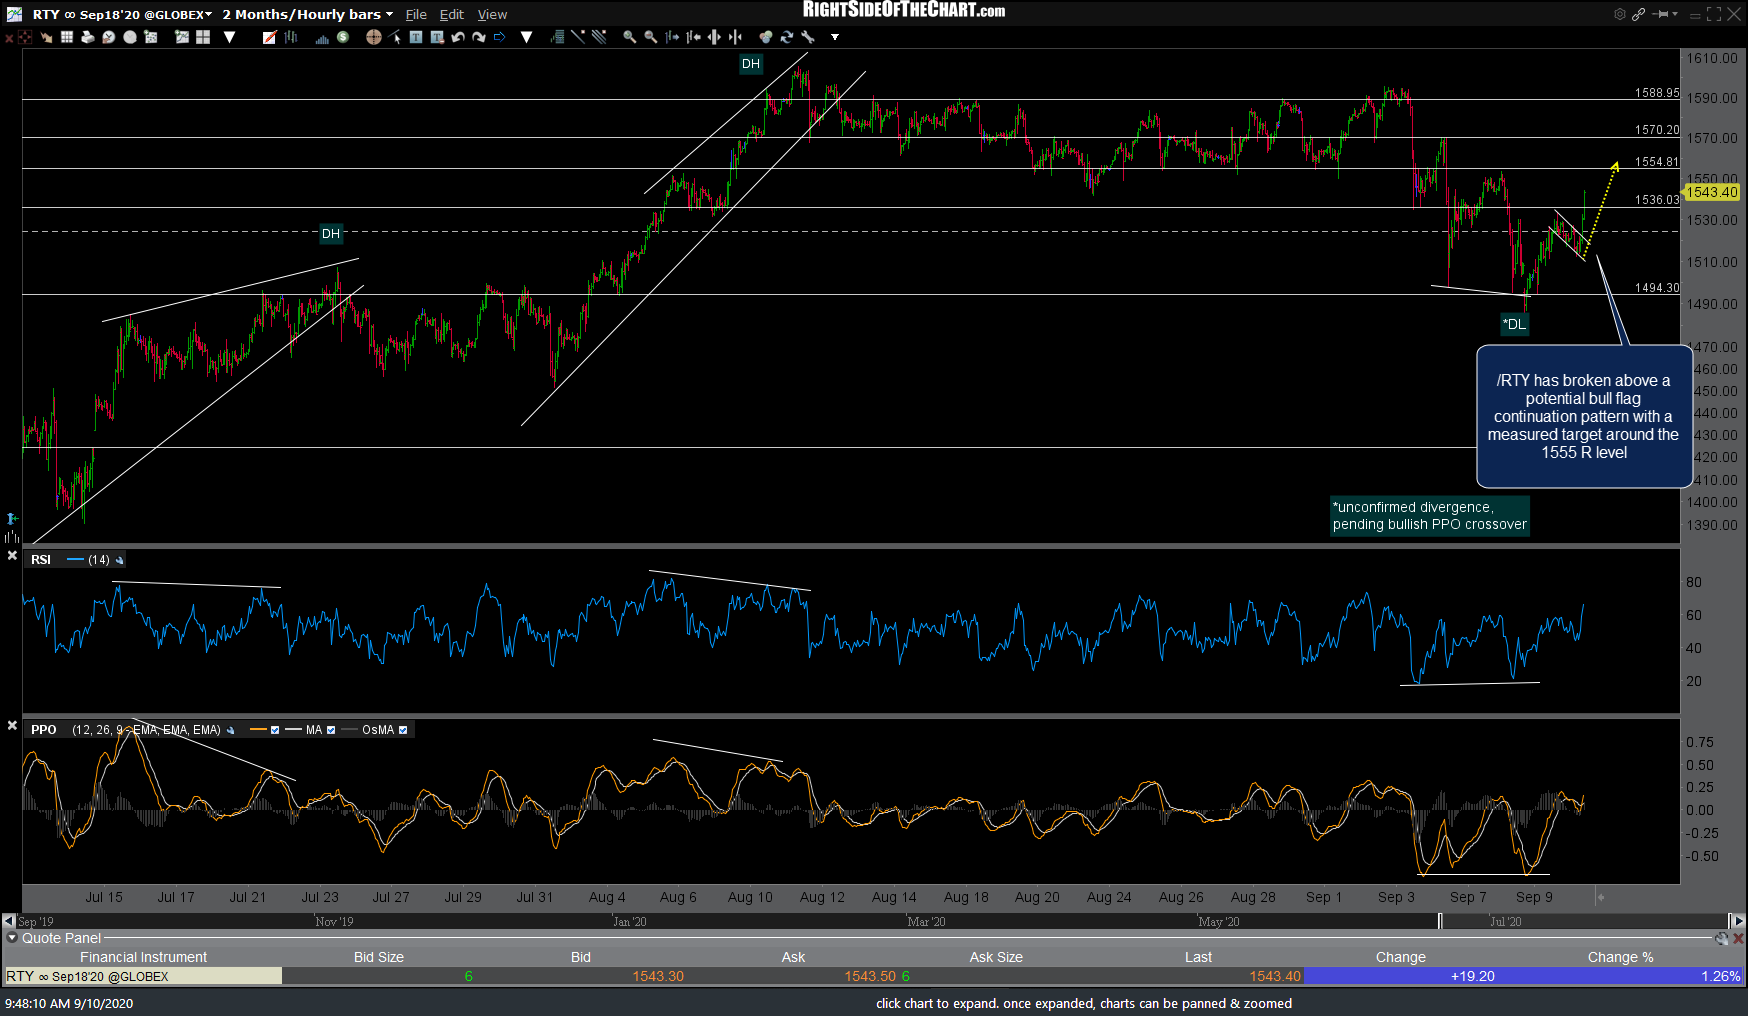
RTY 60m Sept 10th
One strategy for those playing the bounce long would be to raise stops to just below the bottom of the bull flags at this point and/or set a trailing stop & let your positions ride. My bounce targets for QQQ, SPY, & IWM remain the same for now & I didn’t include those charts as the flags don’t appear on the index ETFs as they formed on the futures since yesterday’s close & into the early hours before the regular trading session opened today.