
No need to post a dozen charts as both the S&P 500 & Nasdaq 100 still remain below the key yellow support levels, thereby still pending a “high-probability” sell signal if & when those levels are taken out. Just a reminder that we are still in the wake of what I refer to as “post-FOMC noise” where the initial reaction (so far bullish) following an important FOMC meeting & rate decision, is quite often not the lasting reaction that sticks. As per my comments in recent videos, I like to wait & see how the market is trading towards the end of the week or early next week before reading too much into the initial reaction, especially if there haven’t been any significant technical developments, which as of now, there have not.
QQQ is testing the top of the recent trading range (purple box) while still above the key 433 yellow support on the daily time chart while the divergences remain solidly intact for now.
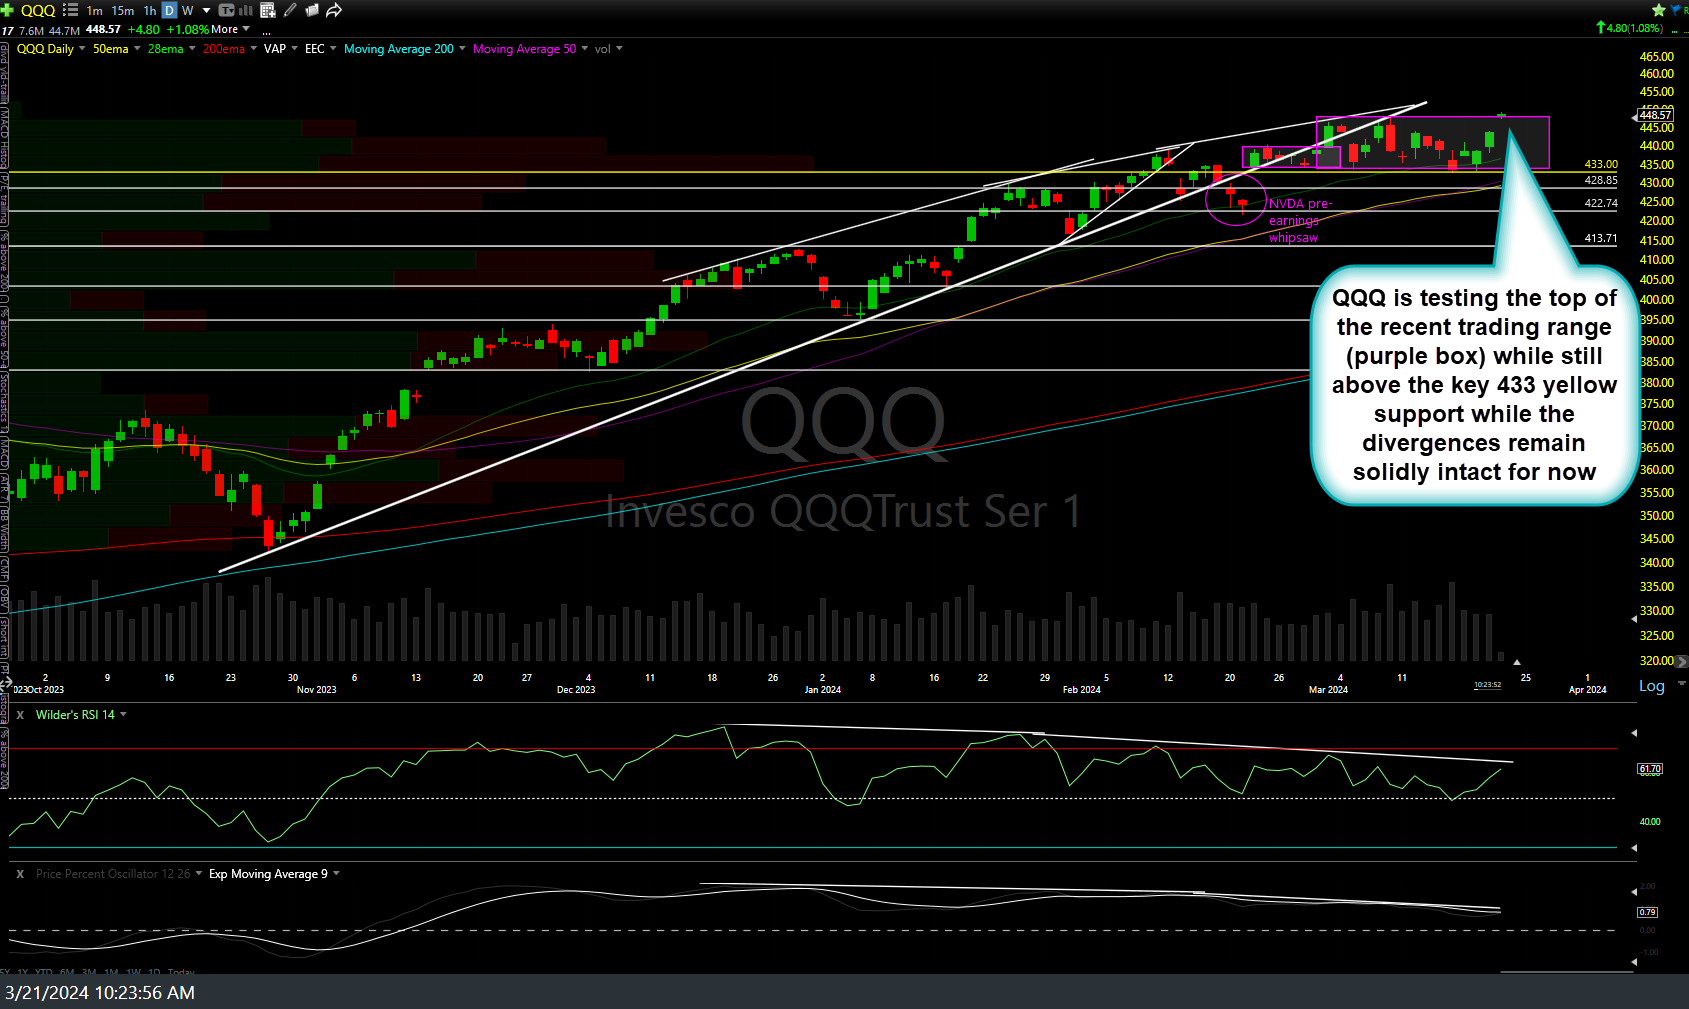
QQQ daily March 21st
SPY remains well above the yellow 502.81 key support as it runs for another backtest of the recently broken primary uptrend line with the negative divergences still intact for now.
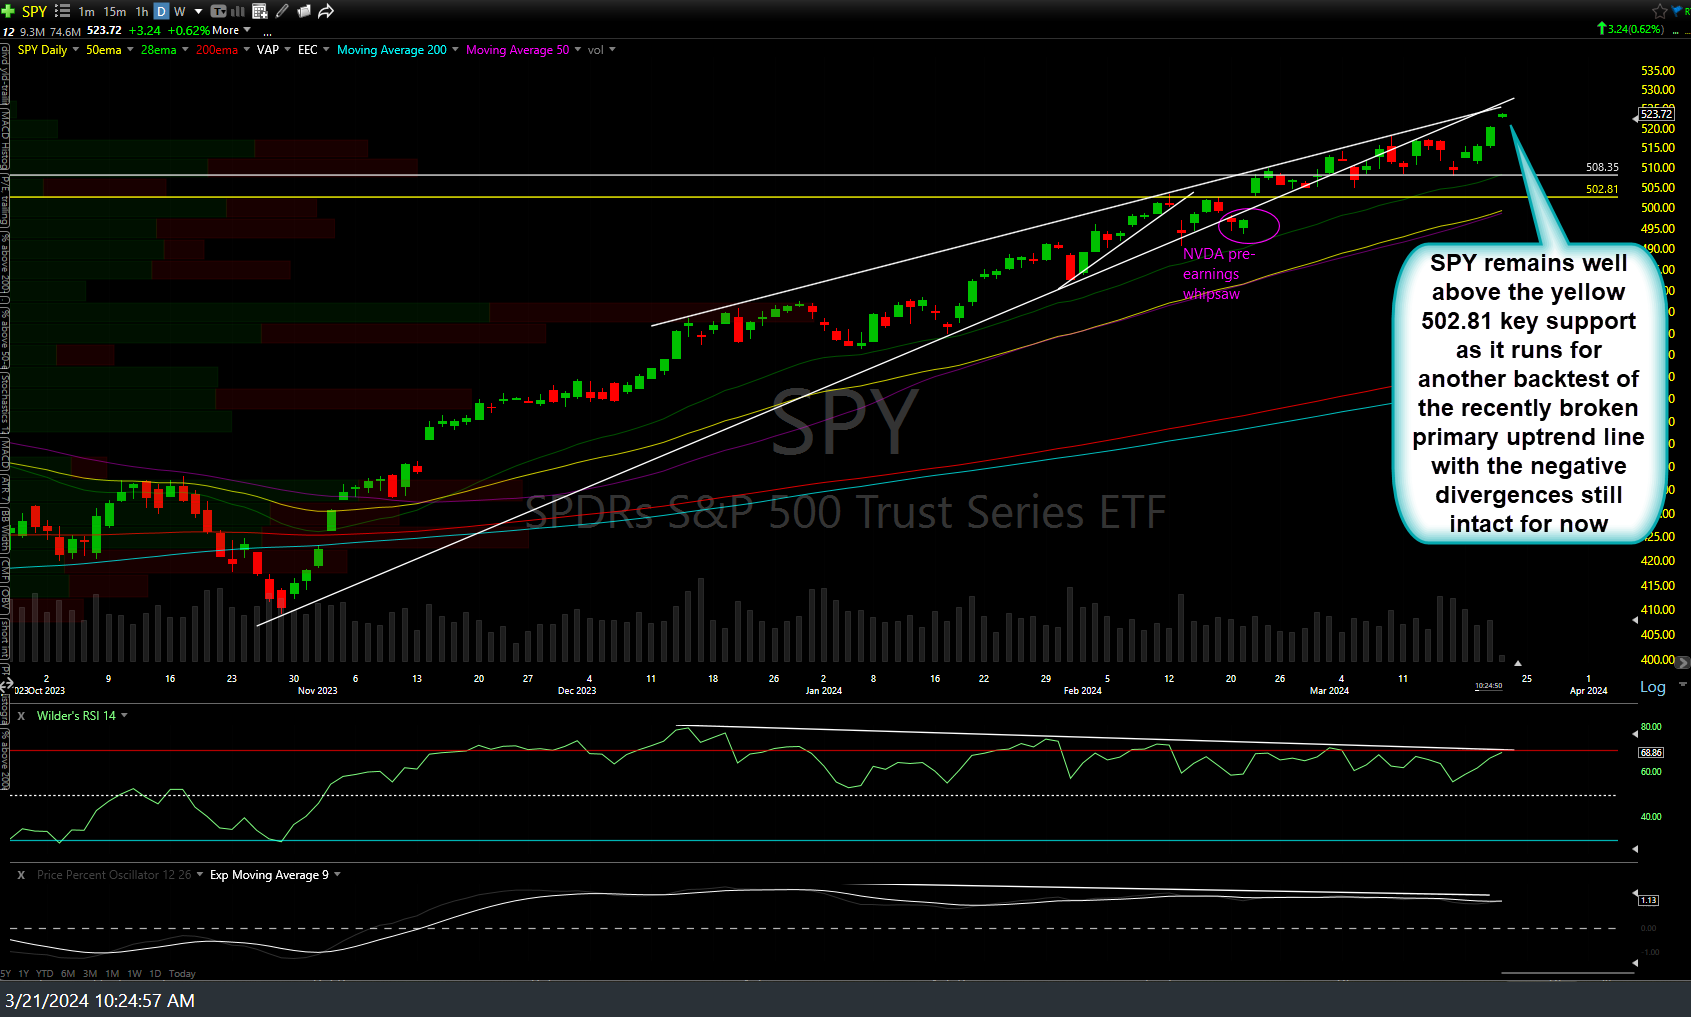
SPY daily March 21st
Most of the remaining stocks in the ever-shrinking “Magnificent #” are still above the key yellow support levels I’ve been highlighting recently but the one that warrants closely monitoring IMO is the “AI King”, NVDA (NVIDIA) along with it’s sidekick, SMCI (Super Micro Computer). As the poster child for the AI hype, it is quite possible that NVDA alone might have the potential to make or break the chances of another significant leg higher in the stock market.
Regardless, from a pure TA (technical analysis) perspective, NVDA remains below the yellow uptrend line as well as the March 8th Bearish Engulfing Candle + divergent high with the next objective short entry or add-on to come on a break below 840. Bulls want need to see NVDA take out that potential topping candle from 2 week ago to increase the odds of any meaningful upside in the tech sector & stock market as a whole while those short still might consider a stop somewhat above it. Daily chart below.
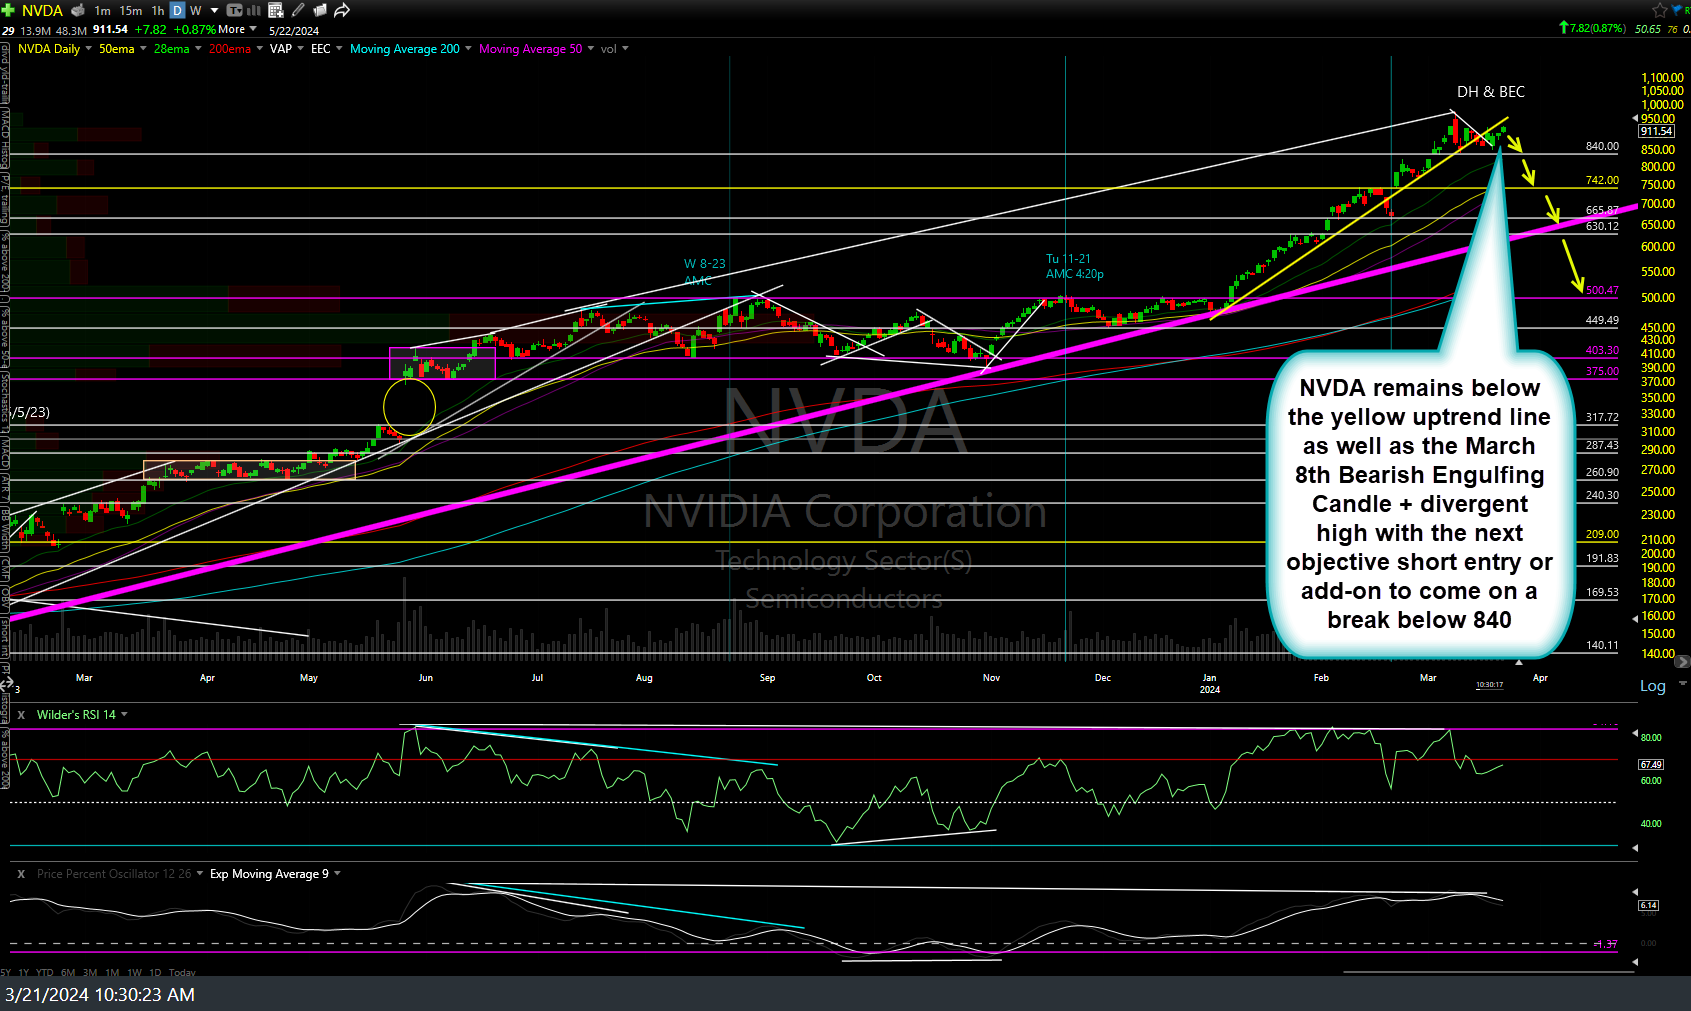
NVDA daily March 21st
For those still short or looking to get short SMCI, I’m watching watch could prove to be a potential Bear Flag continuation pattern on the daily time frame with the next objective add-on or new short entry to come on an impulsive breakdown below the flag. While my sole price target remains just above the 355.60 support, there is a decent chance of a reaction around the 690 level, should we get an impulsive break below the bear flag, especially if the post-FOMC pop is entirely faded soon.

SMCI daily March 21st
Last but certainly not least, IEF (7-10 yr Treasury Bond ETF) remains with the YELLOW ZONE which increases the odds that the post-FOMC rally may soon be faded & those odds would sky-rocket should IEF drop into the ORANGE ZONE (or decrease if exiting above the yellow zone).
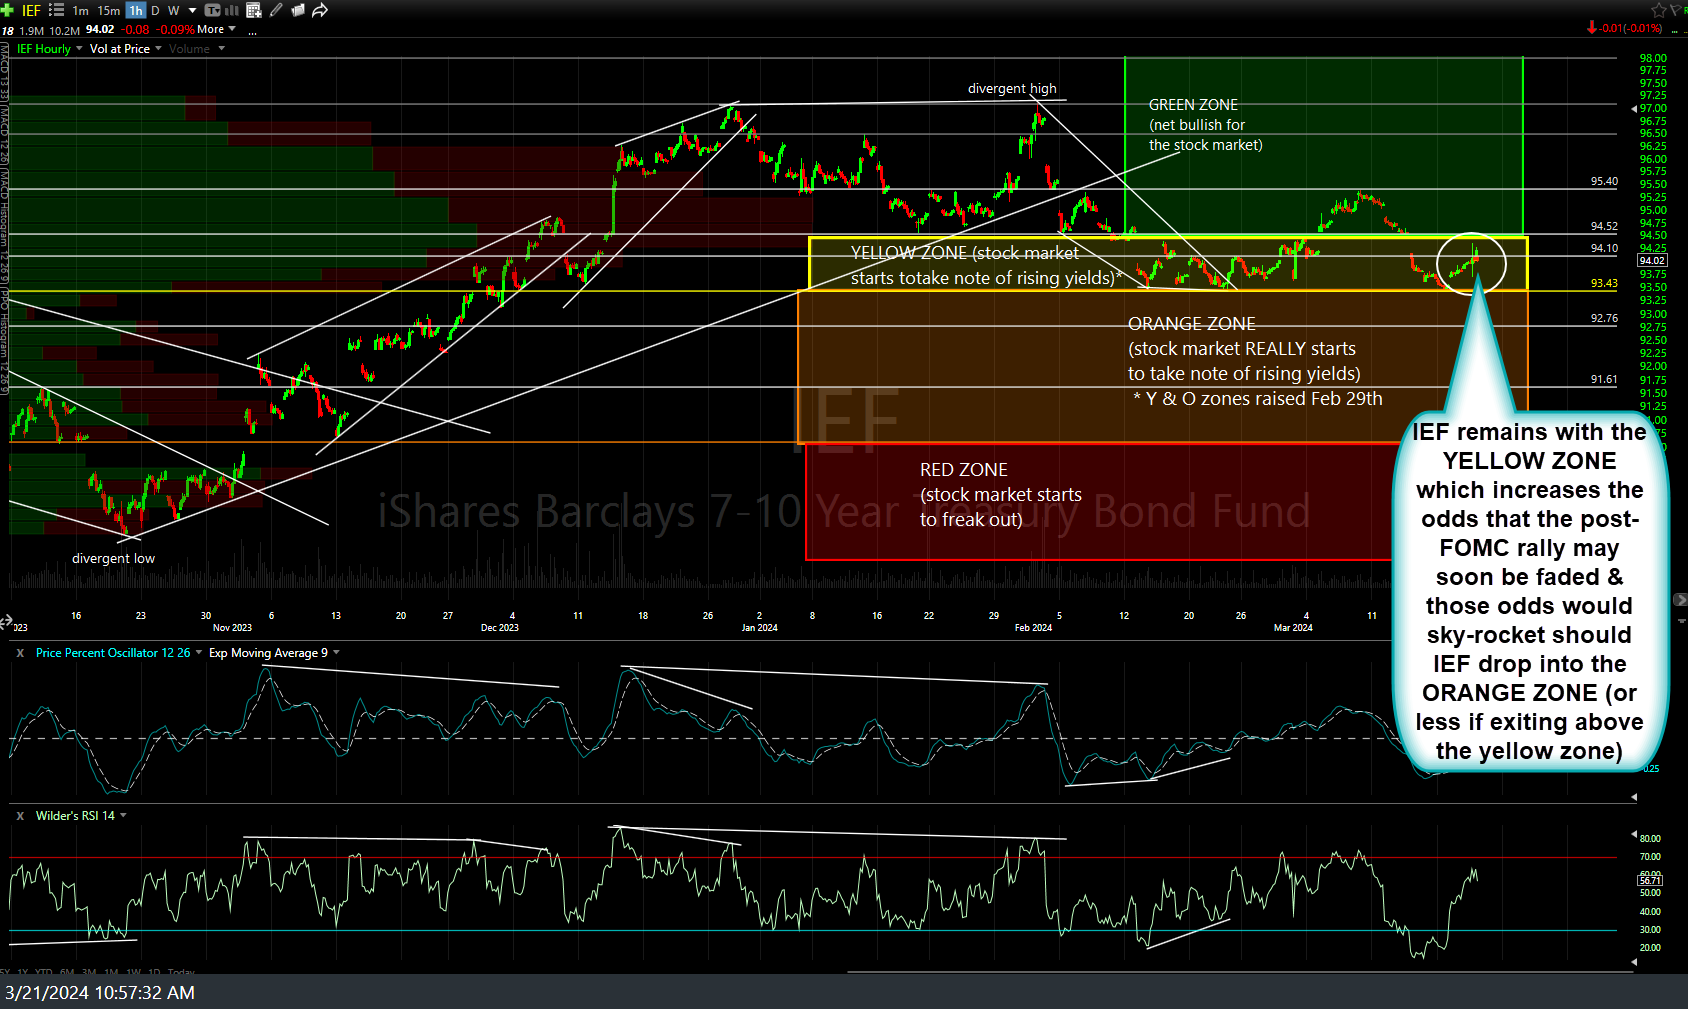
IEF 60m March 21st