
Member @ruben made a request for the charts of NFLX, BA & GIS within the trading room. As each of these look like potential trading opportunities (the former 2 as shorts & the latter as a long trade), I figured that I would post the charts here on the front page for any members that might be interested in any of these stocks. As I have been finding it increasingly difficult to identify attractive long-side trade ideas, particular with individuals stocks, I’ll start with GIS (General Mills Inc).
GIS may likely continue down to around the 54.30ish support level before bottoming, which would offer an objective entry, it might also offer an objective long entry on a breakout above this bullish falling wedge pattern before then. However, should a breakout occur soon, my preferred scenario would be a backtest of the wedge at lower levels, quite likely the 54.30ish area, before a new uptrend begins.

GIS daily May 18th
From a fundamental perspective, I also like GIS as a potential bottoming play, again, ideally if it falls near the 54.30 support level & the charts confirm the bullish case for an entry at that time, for a couple of reasons. First of all, GIS is a defensive stock. Defensive stocks are companies whose business model is relatively unaffected by slow-downs or contractions in the economy & as such, their stock price tends to hold up & often outperform stocks that are more effective by the economic/business cycle (think tech stocks, growth companies, etc…) General Mills also pays an attractive dividend of 3.42%. All other things being equal, stocks that pay average to above average dividends, particularly those with a steady history of dividend payments, tend to hold up better during a market downturn that stock that pay little to no dividends. GIS is under consideration as an official Long Swing Trade as well as a Growth & Income trade although I think that the stock has a little more downside (~2,5%) before a decent case for an objective entry can be made.
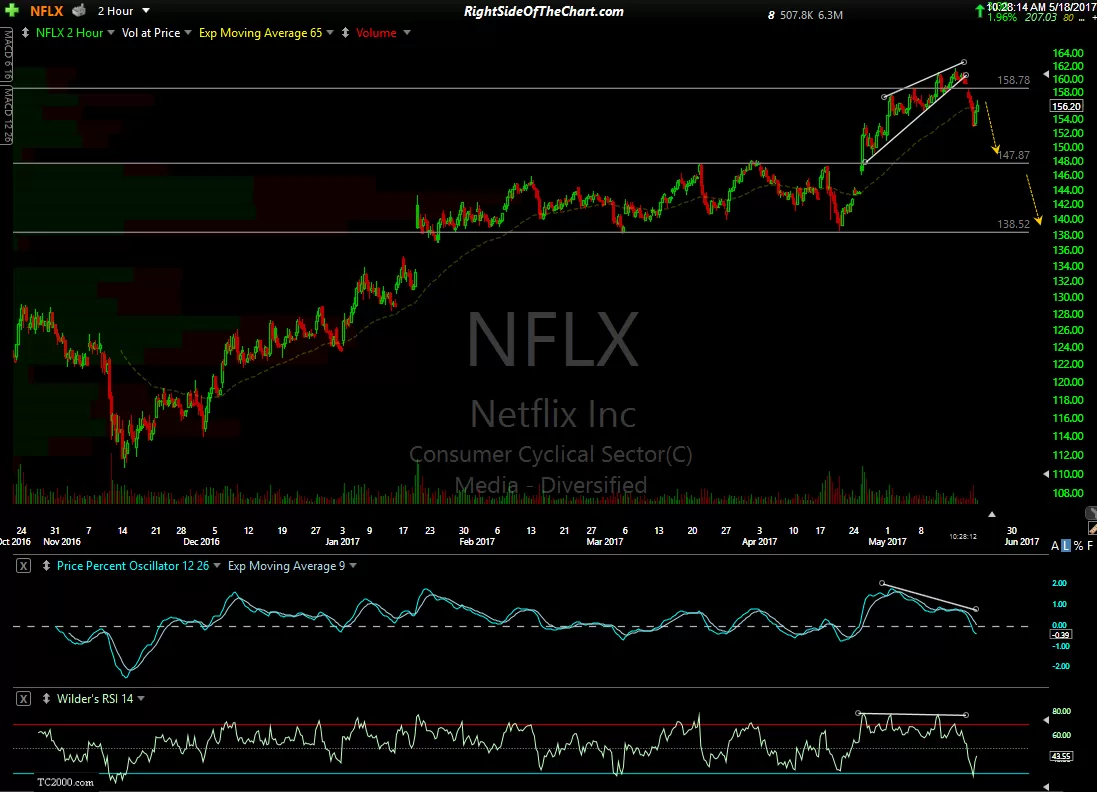
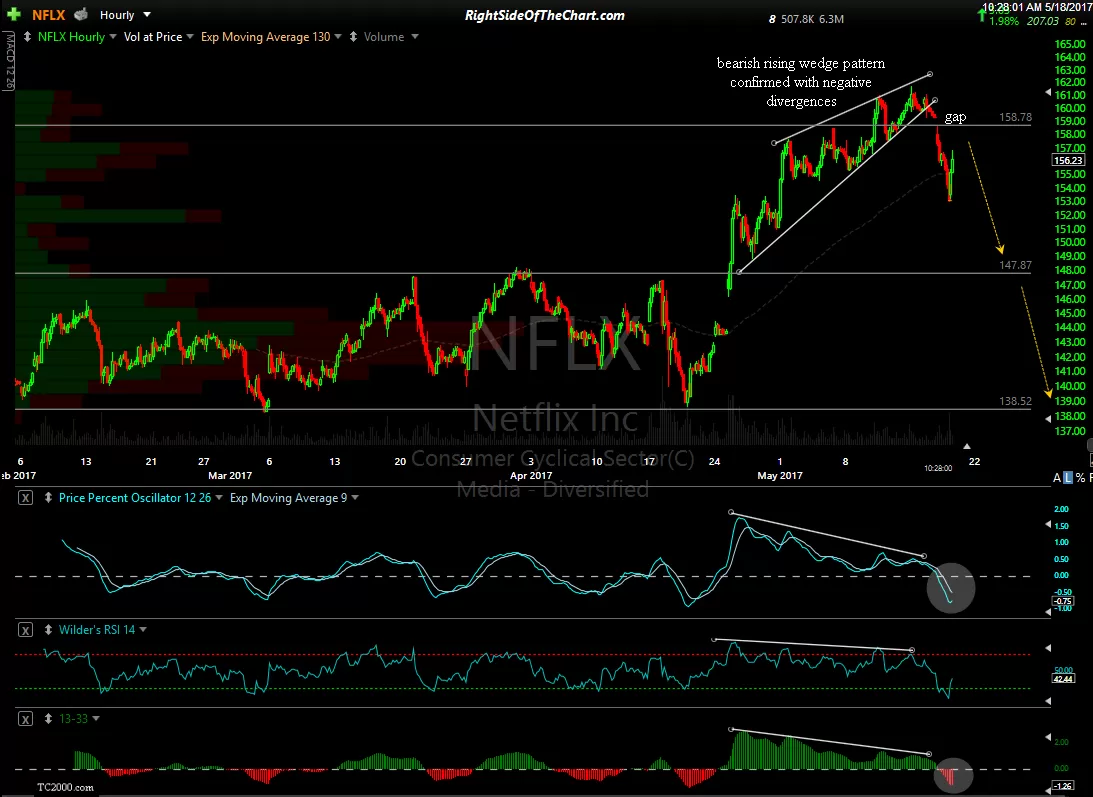
NFLX (Netflix Inc.) looks like an attractive short, quite possibly around current levels as I think a decent case can be made that the stock topped on Monday of this week. I might even take a short position personally right after I finish this post & will consider adding NFLX as an official short trade idea as well. Hard to say if the stock will be able to rally back up to the bottom of yesterday’s gap at 152.7 or not (I’m guessing not) but if so, that would certainly provide an objective short entry with a stop set somewhat above the recent highs, ideally on a daily closing basis. Daily, 120-minute & 60-minute charts below.
-
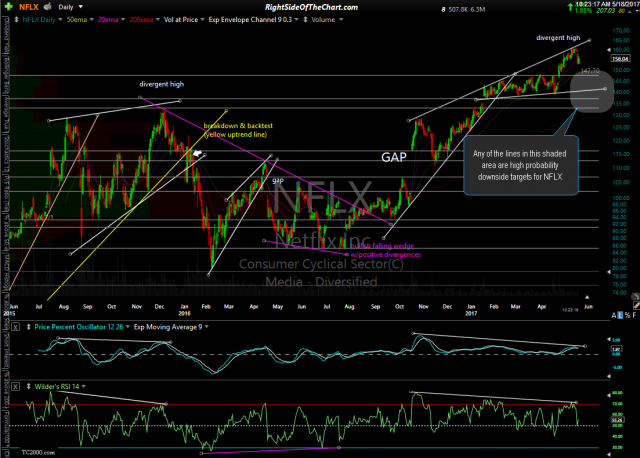
- NFLX daily May 18th

-

- NFLX 120-min May 18th
-
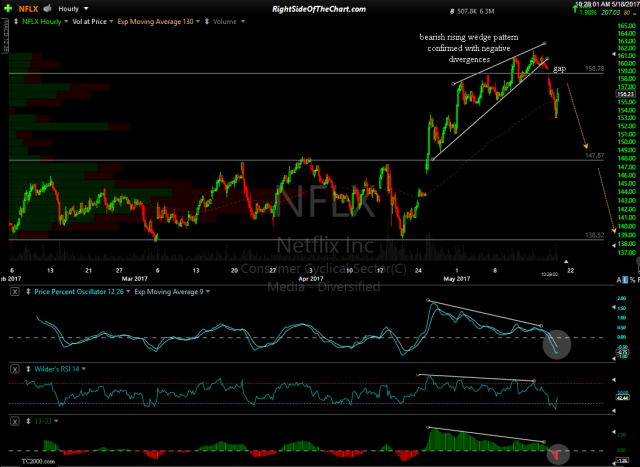
- NFLX 60-minute May 18th
BA (Boeing Co), like Netflix above, is a cyclical stock, meaning that its stock price is affected by the ups & downs of the economy. Although BA currently pays a decent dividend yield of 3.11%, which should help to cushion the fall in a downturn of the economy and/or stock market, from the look of this daily chart it appears that Boeing is poised to fall another 9.5% in addition to the 5% drop so far since the stock put in a divergent high last week. The three support levels shown on this daily chart are each potential price targets, each of which are likely to produce a reaction upon the initial tag.

BA daily May 18th