
Over the past few years I’ve highlighted a fairly consistent pattern that I refer to as the OpEx ramp. As this 2-year chart of QQQ highlights, there has been a relatively consistent pattern of the market rising into standard Options Expiration (3rd Friday of each month), followed by a correction. The chart, as well as the likely reasoning for the few exceptions in which the post-OpEx fade did not occur is explained in more detail in the video at the bottom of this post. Today is standard OpEx for the October contracts & as such, the odds favor a pullback starting sometime next week.
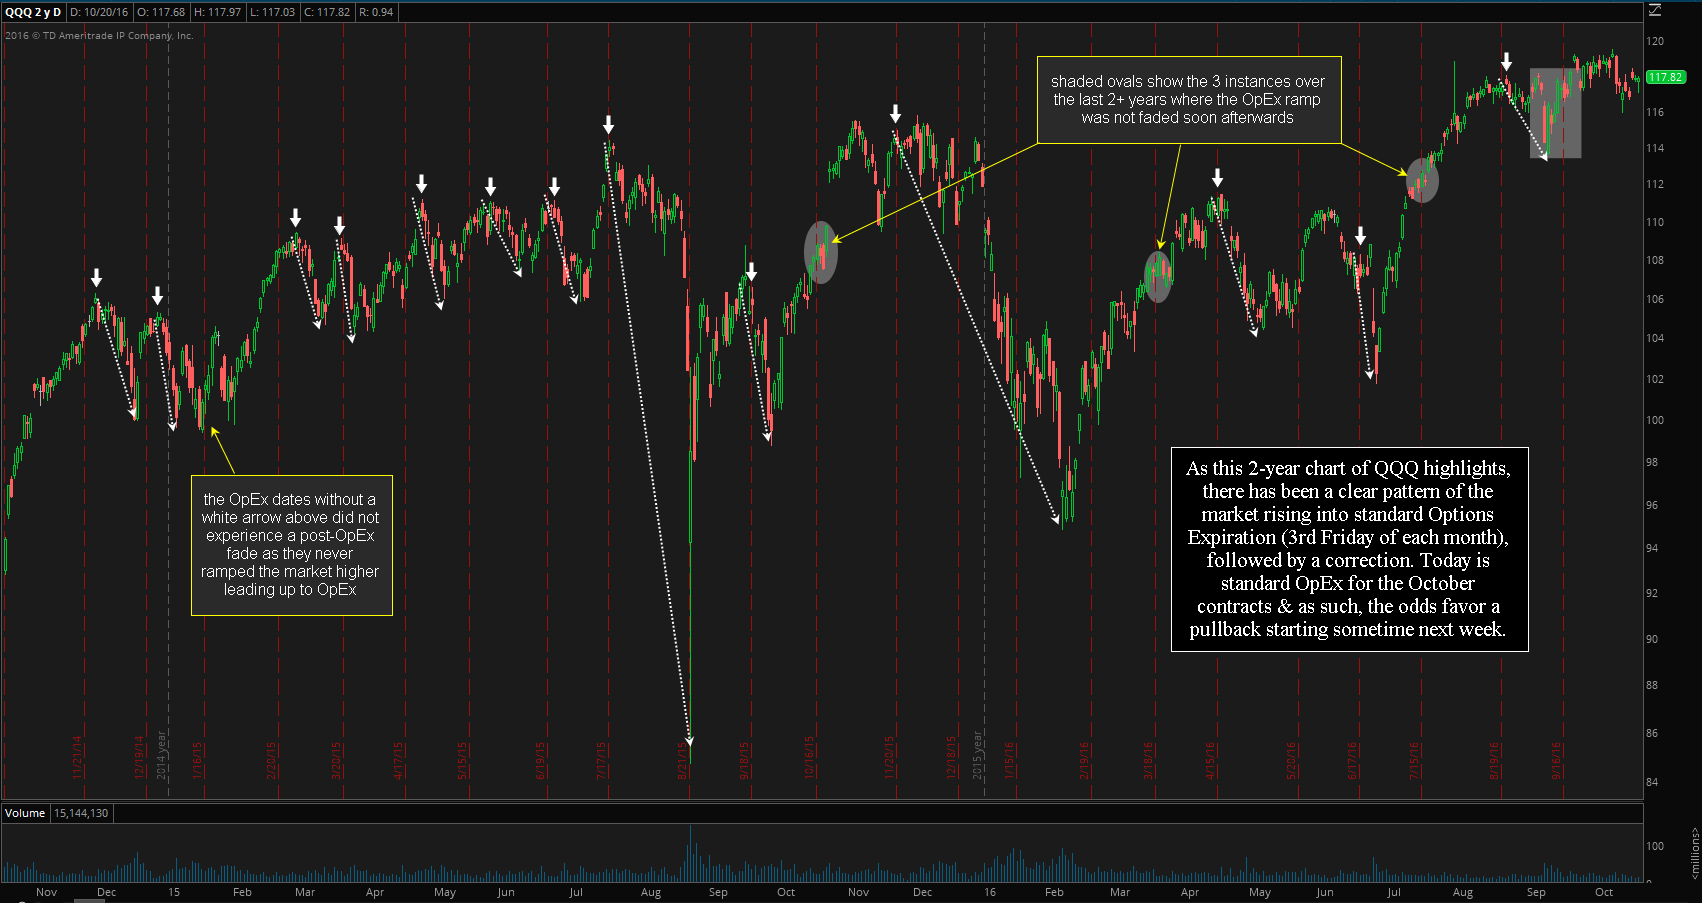
QQQ OpEx Ramps 10-12-16
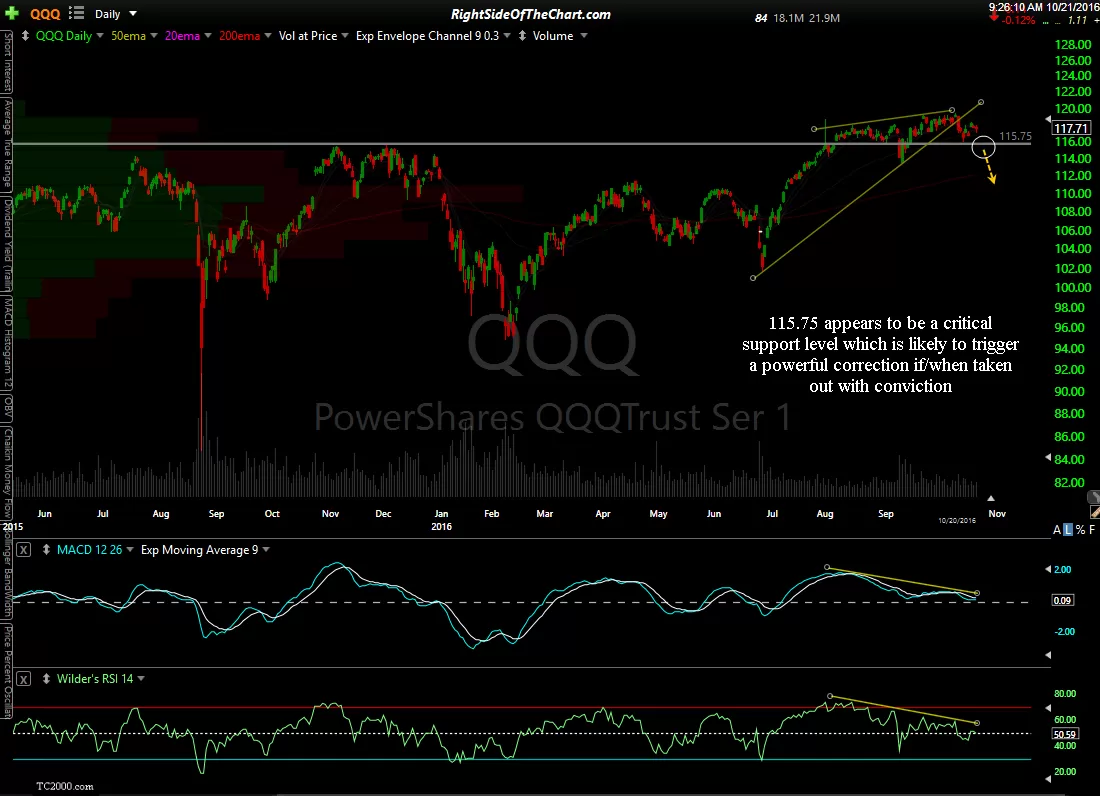
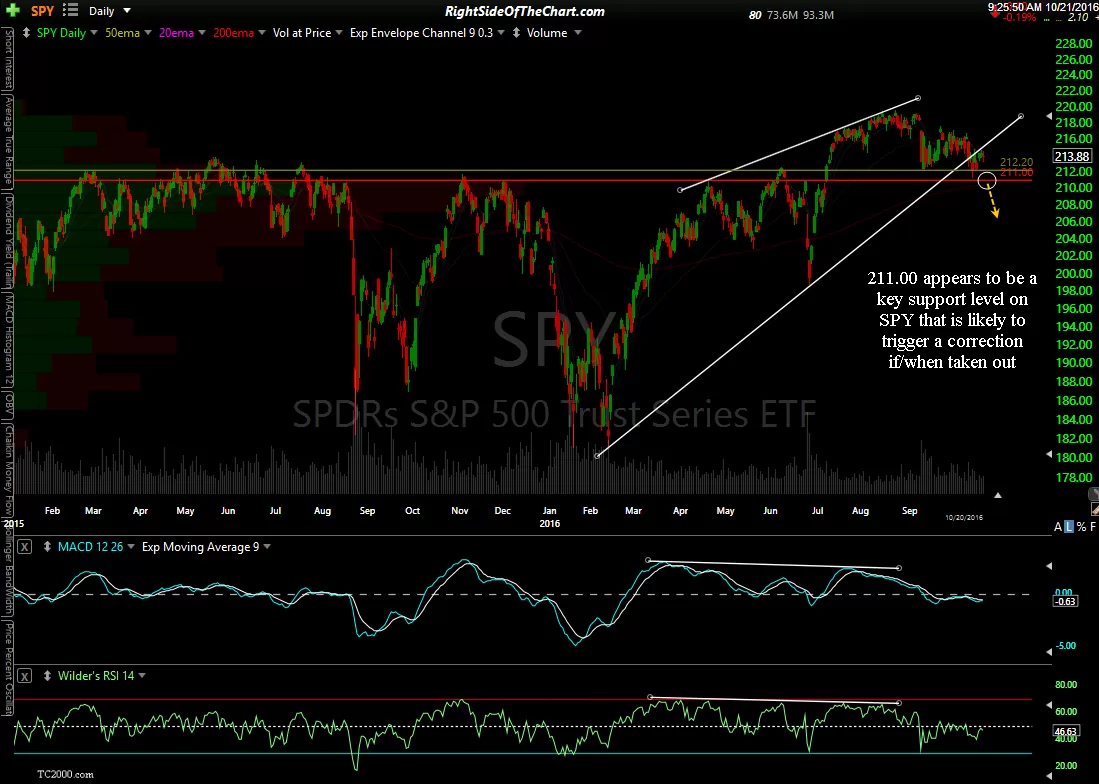
I also wanted to point out a couple of key support levels as a follow-up to the US Equity Markets “Flashpoints” & Target Levels post made earlier this week in which some potentially critical support levels on most of the major US stock indices were highlighted. I wanted to share some comparable key support levels to watch for on the most popular index tracking ETFs; QQQ & SPY. 115.75 appears to be a critical support level which is likely to trigger a powerful correction if/when taken out with conviction while 211.00 appears to be a key support level on SPY that is likely to trigger a correction if/when taken out.
-
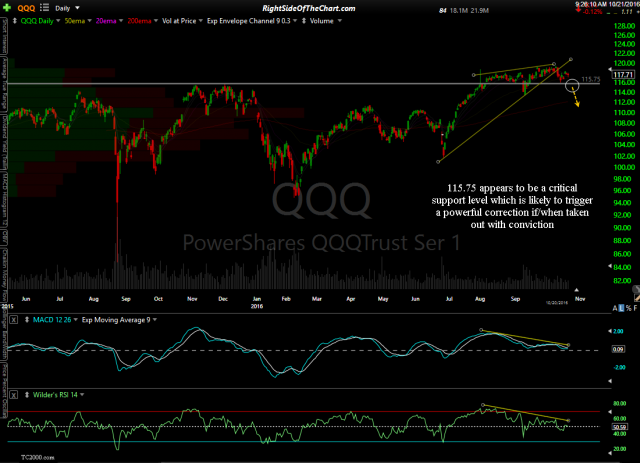
- QQQ daily Oct 21st
-
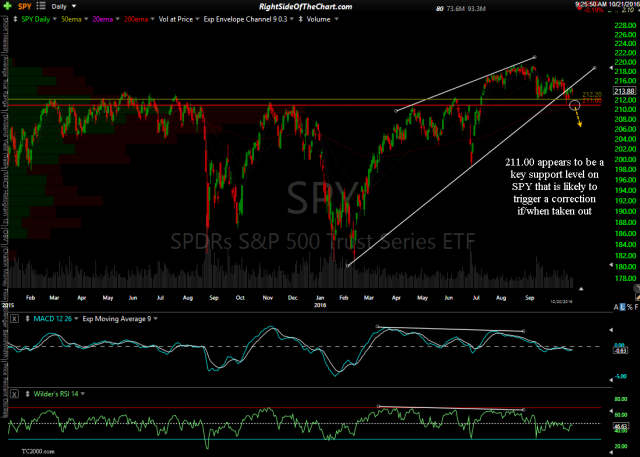
- SPY daily Oct 21st
The following video provides a more detailed analysis & explanation of the OpEx ramps & subsequent corrections as well as a brief discussion on those key support levels for QQQ & SPY.