
/NQ (or QQQ) still offers an objective long entry at the uptrend line for a quick 1% trade up to the downtrend line (top of triangle) while solid break below or above the triangle pattern could trigger the next buy or sell signal. A tight stop for the short-term (downtrend line target) trade would be somewhat below the uptrend line or a wider stop slightly below the 11745 support. 10-minute chart below.
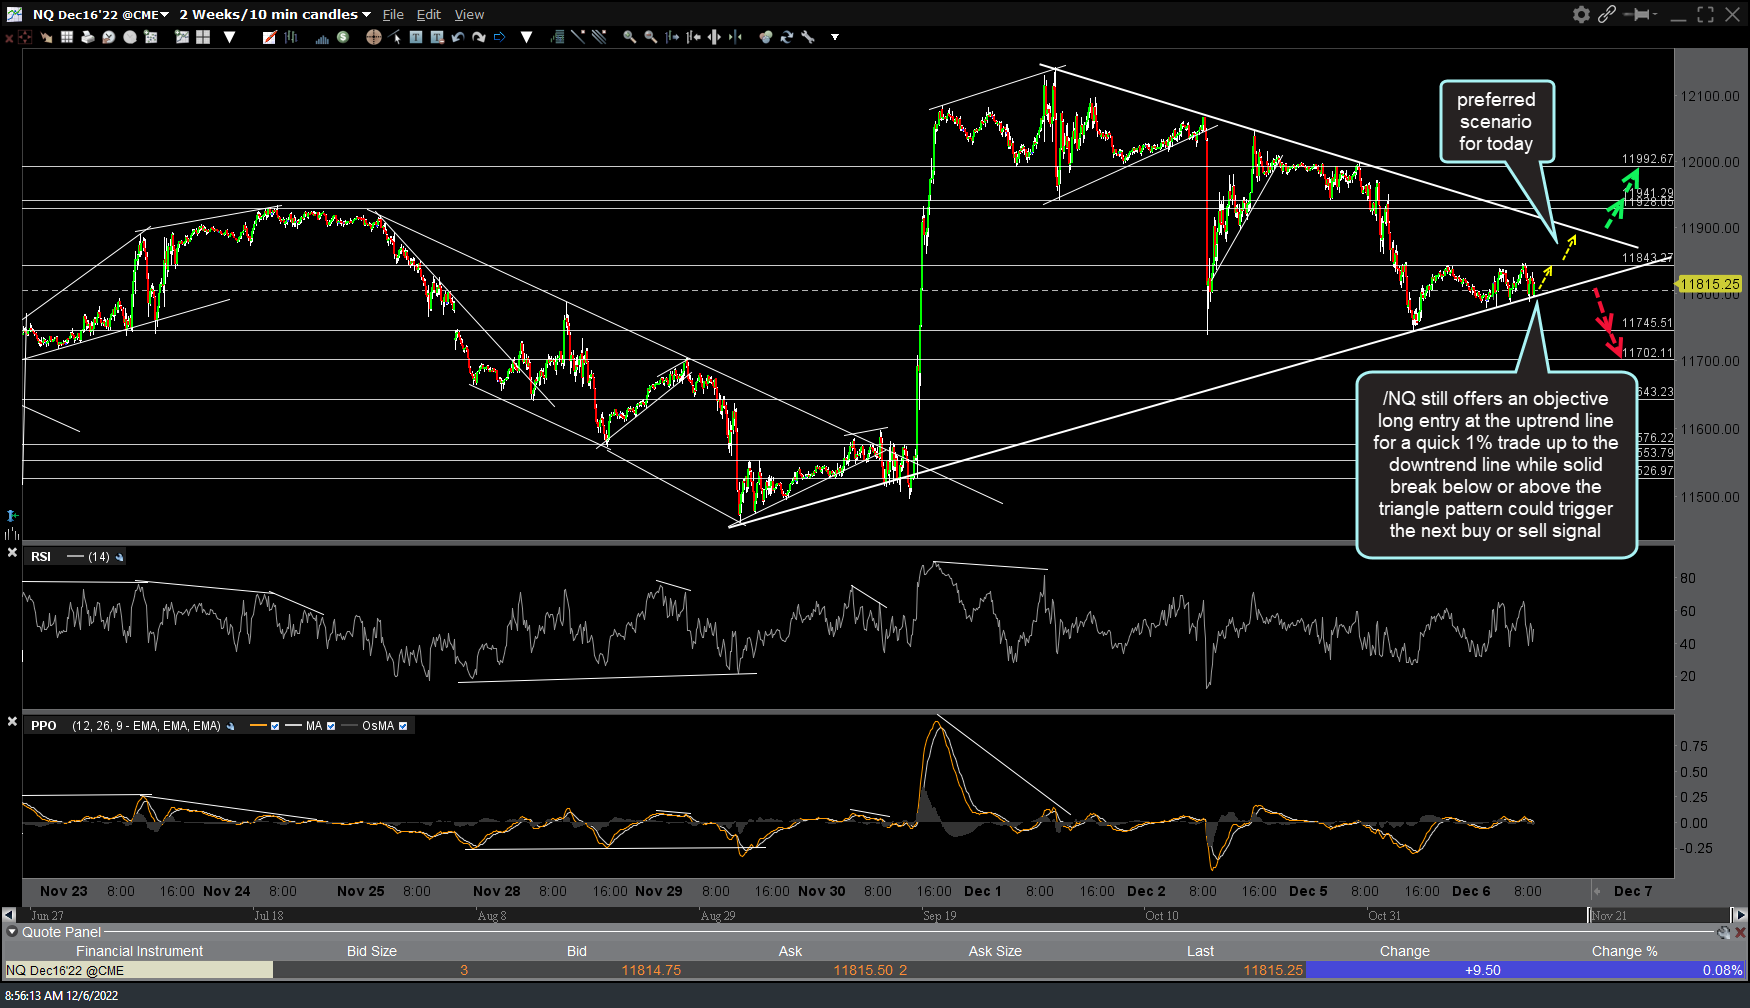
NQ 10m Dec 6th
As highlighted late yesterday, QQQ is still trading slightly above the uptrend line off the early Nov lows with any pullback to that level offering an objective long entry for another potential thrust up within the bearish rising wedge before it breaks down (ideally, after next Wed’s FOMC announcement).60-minute chart below.

QQQ 60m Dec 6th
One reason to give a long trade taken at the /NQ uptrend line a little wiggle room if it undercuts that uptrend line on the 10-minute chart is that QQ has a decent chance of testing this comparable trend since it is so close. Also, as mentioned late yesterday, SPY offers an objective long entry here at the uptrend line for one last thrust up inside the wedge before a more powerful sell signal comes on a breakdown below it. 60-minute chart below.
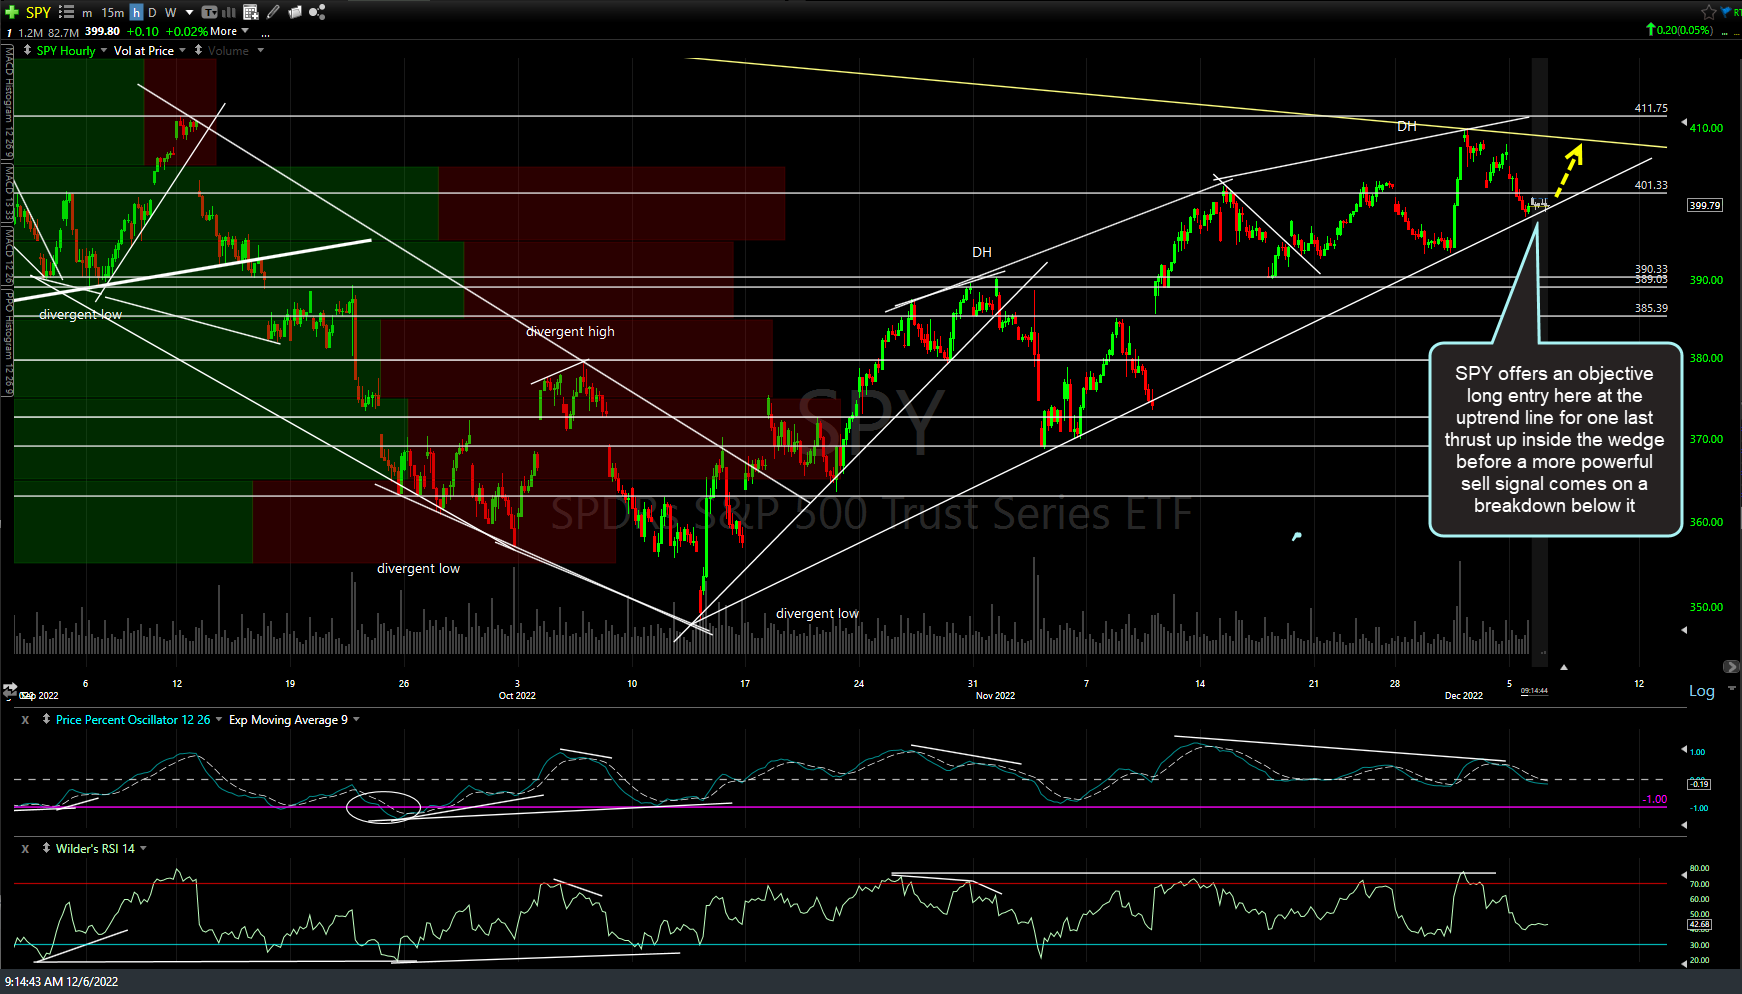
SPY 60m Dec 6th