
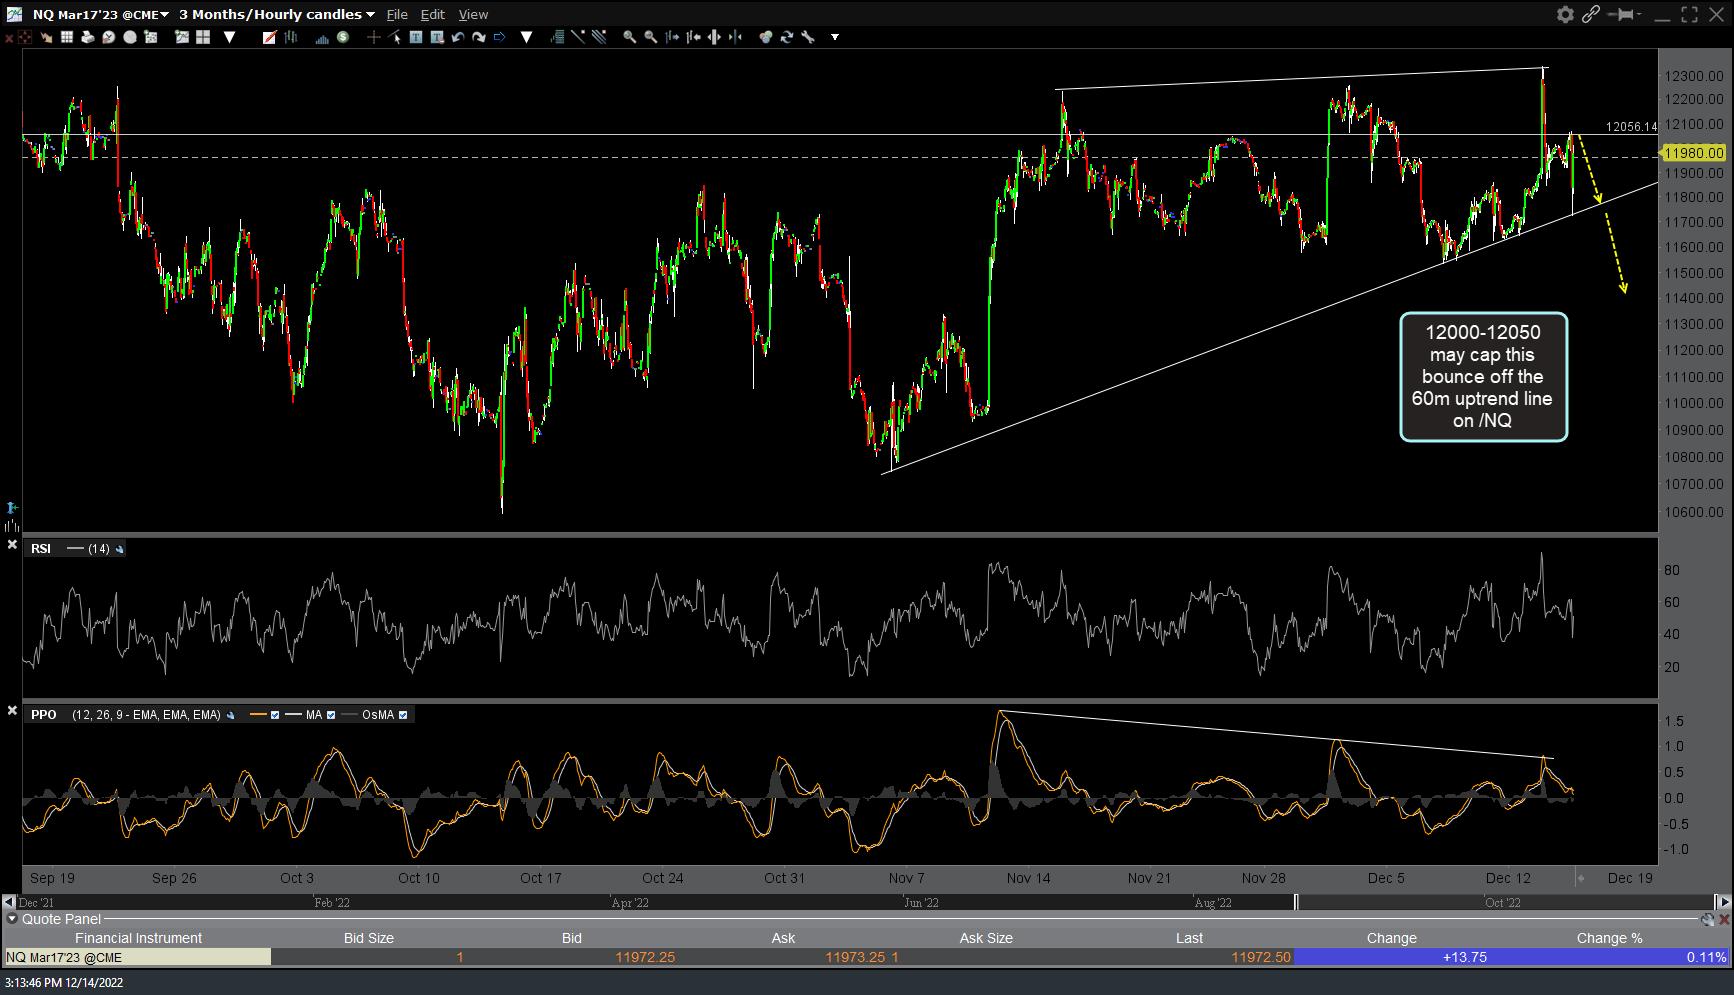
/NQ (and QQQ) did go on to mount one last bounce off the uptrend line as expected yesterday with that bounce also being minor (as expected). It also went on to trigger the next sell signal with a break below the uptrend line & is now trading on the first support level where the odds for a reaction before the next leg down is decent.
I’ve added some additional support levels/price targets to the updated 60-minute charts of /NQ & QQQ below. The first 60-minute /NQ chart was the one posted in yesterday’s final post followed by the updated chart with the likely bounce target & reversal point posted in the comments below that post, followed by the updated 60m chart with some potential bounce targets & additional downside targets. Active traders might use these targets to game quick long & short trades while typical swing & trend traders scaling into longer-term short position could strategically add to that position on rallies back to resistance and/or breaks below support.

NQ 60m Dec 14th
NQ 60m 2 Dec 14th.png
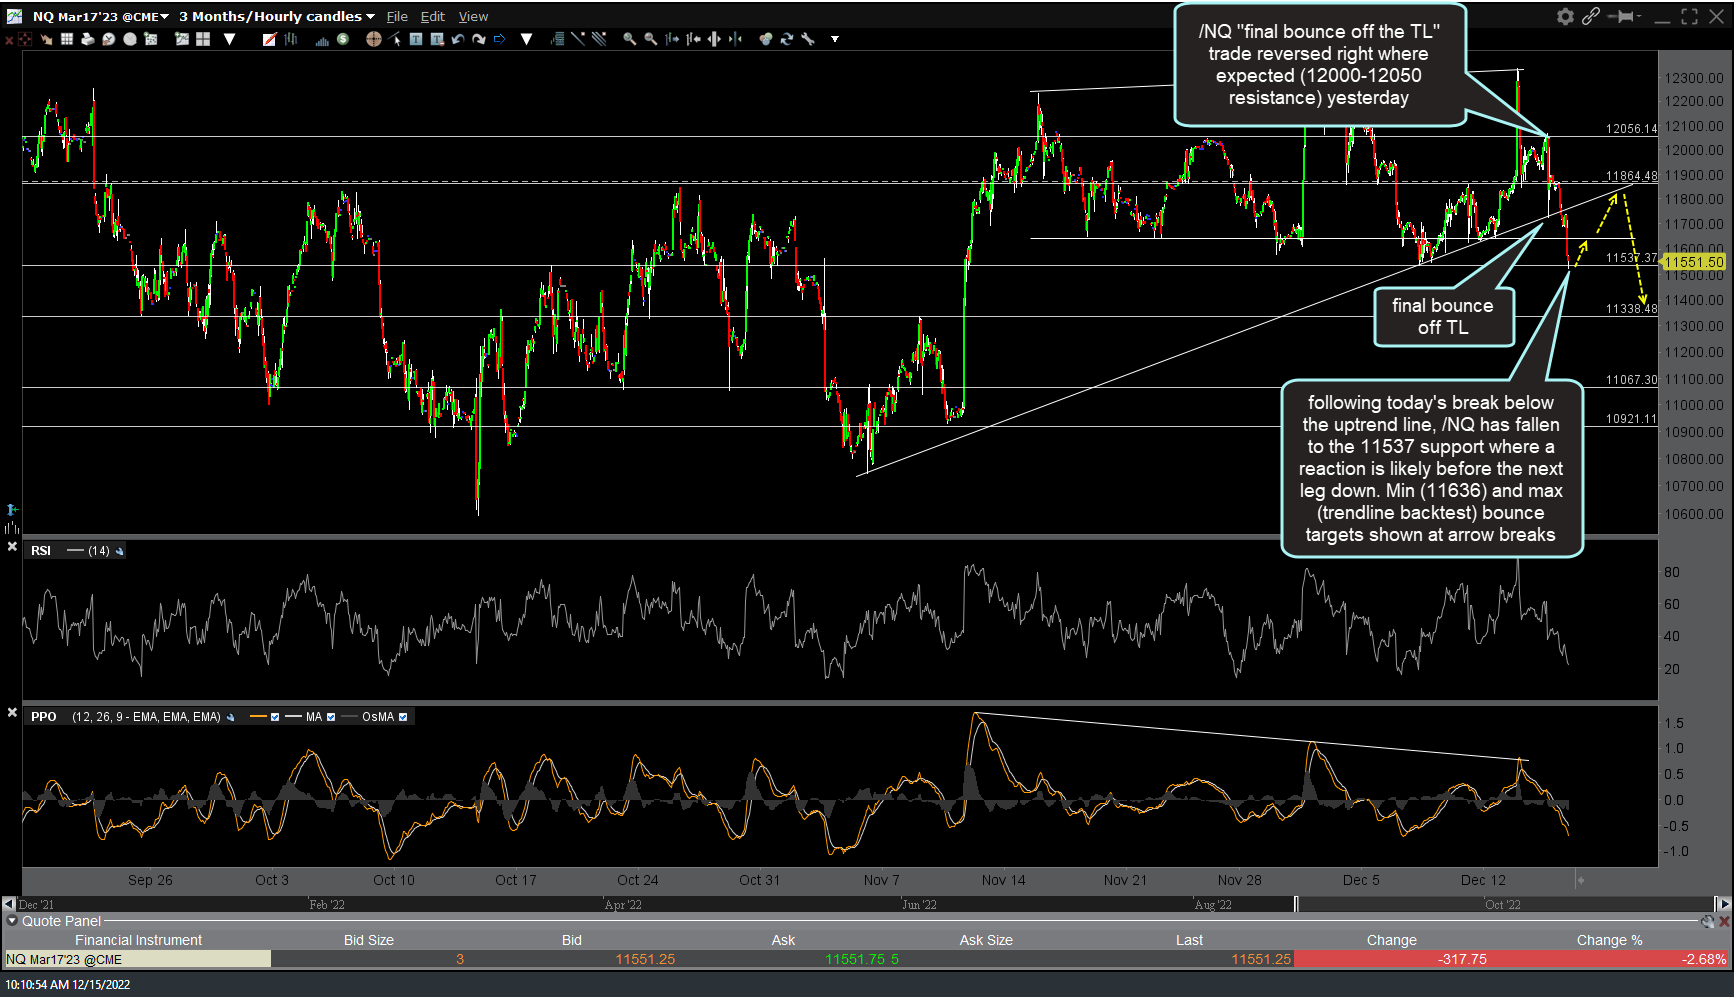
NQ 60m Dec 15th
Here’s the updated 60-minute chart of QQQ with some nearby support & resistance levels.
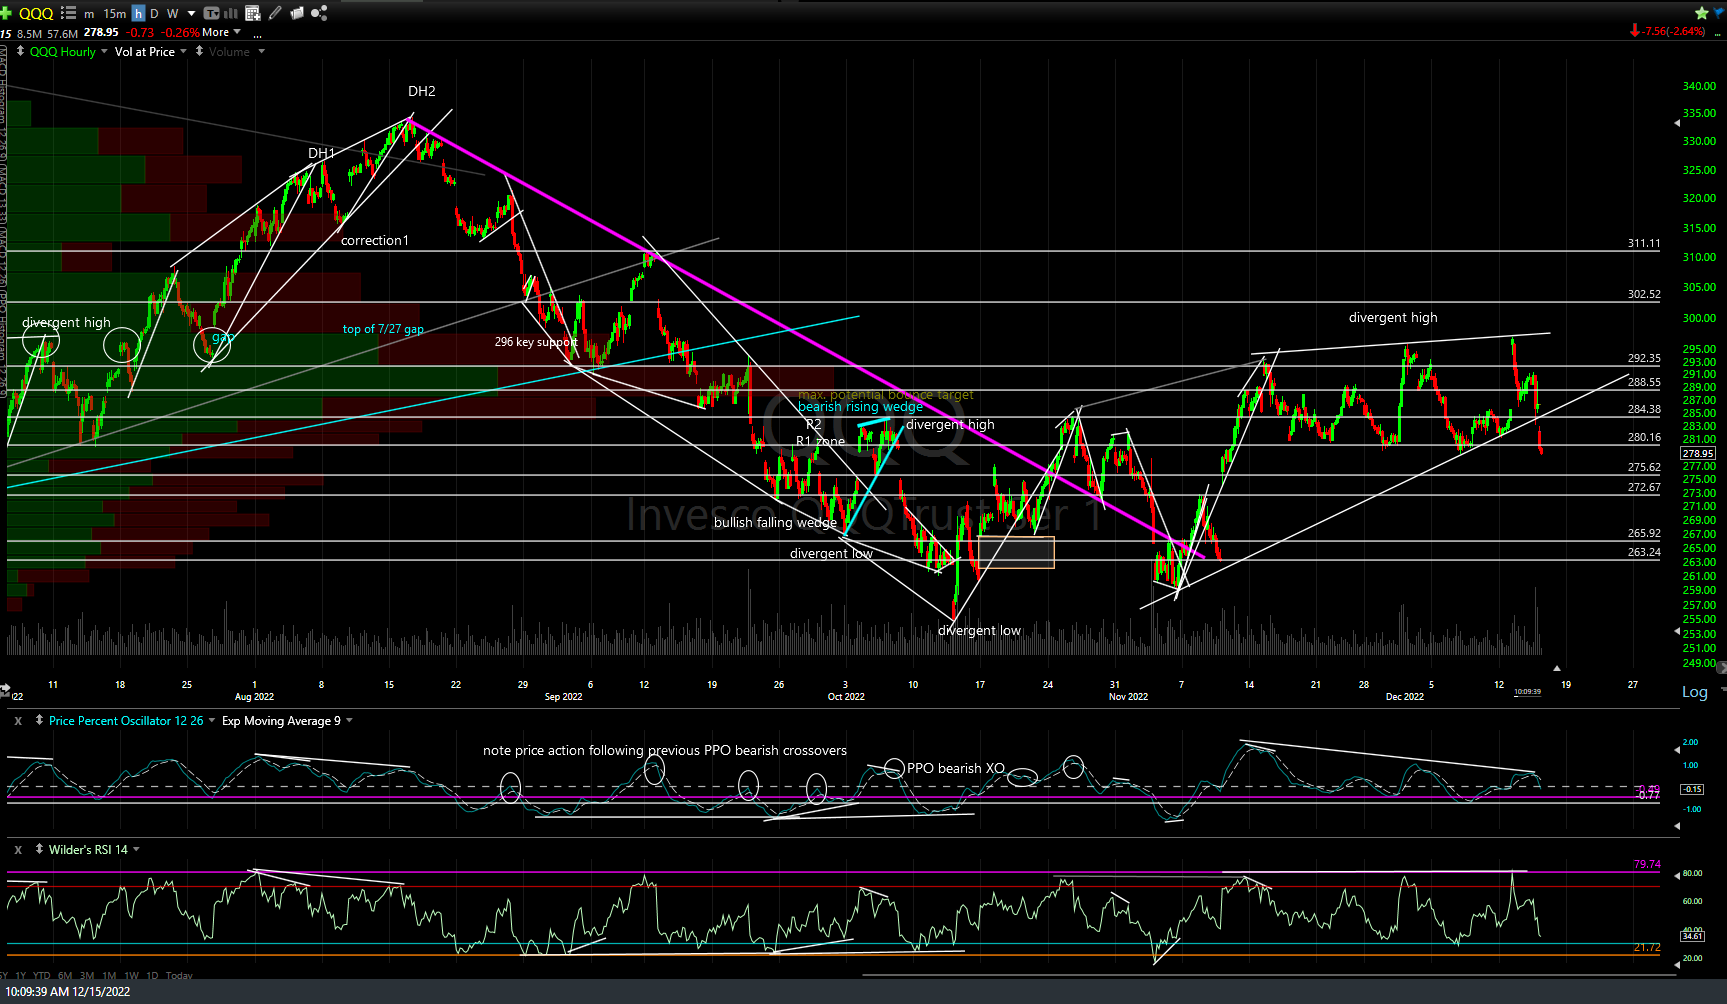
QQQ 60m Dec 15th
I’m still battling what I now know is Flu A, and a pretty nasty one at that. As such, I will do my best to post any significant developments or trading opps that I come across although updates will continue to be on the lighter side at least through today.
Oh yeah, I should have included the SPY 60-min chart, which is also at support, so I just took a screenshot to add to this post:
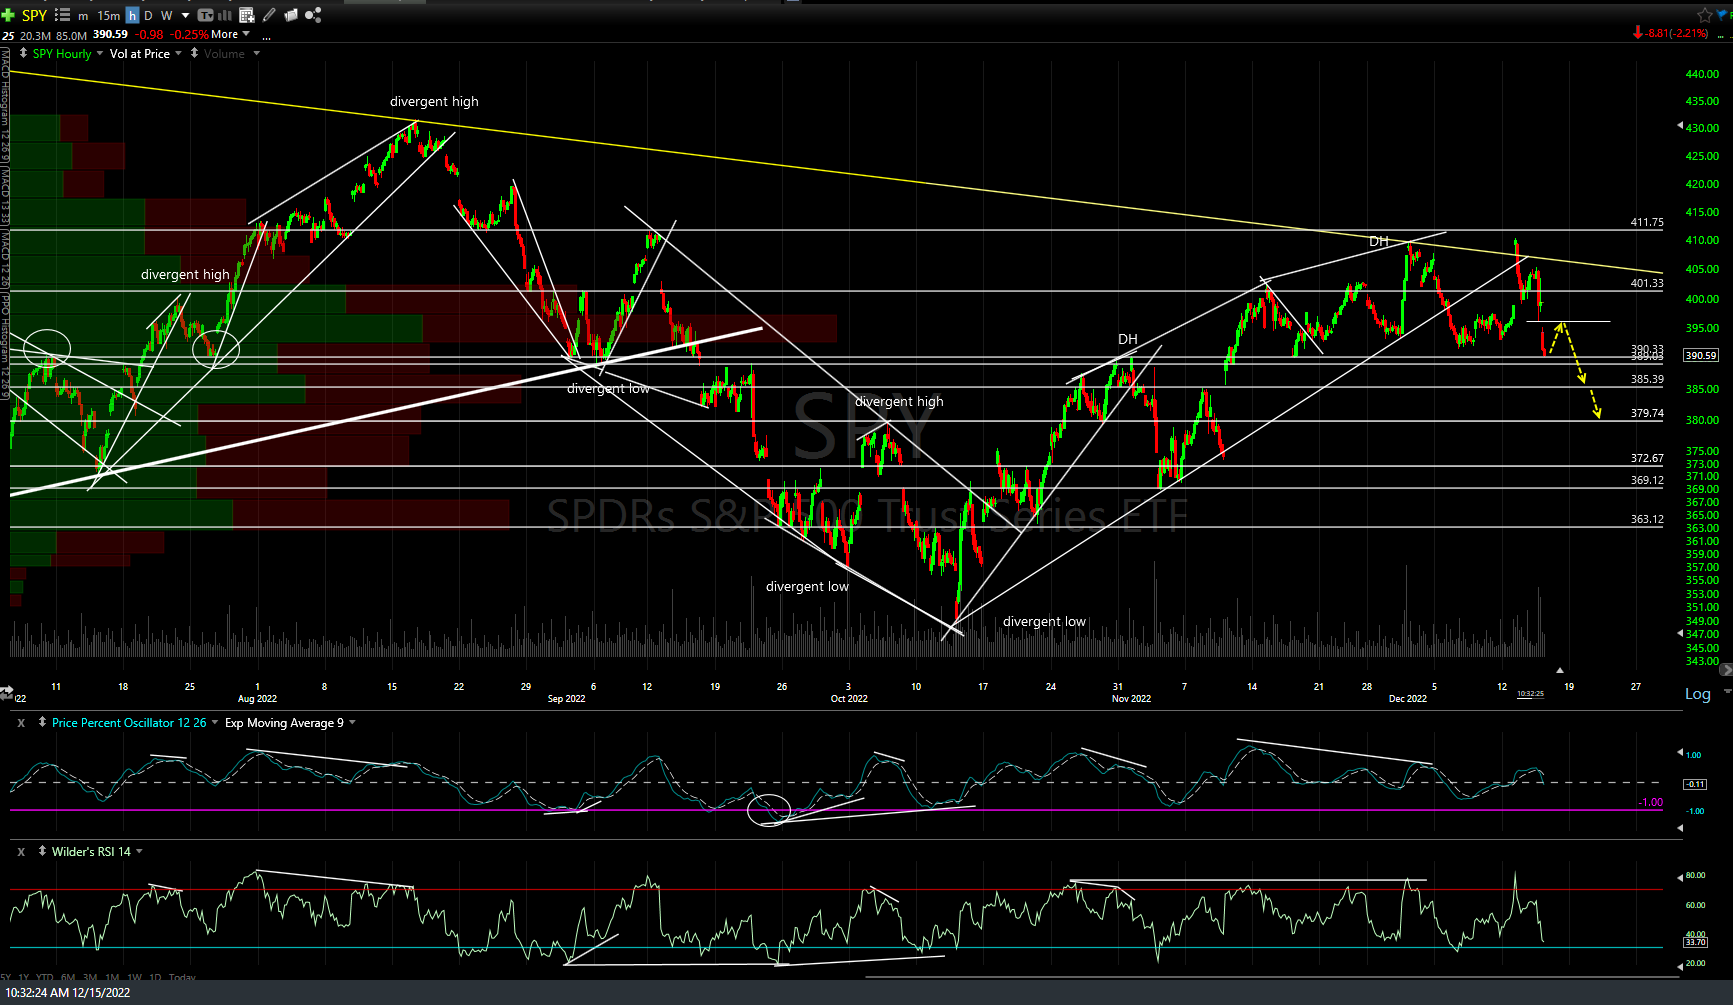
SPY 60m Dec 15th