
Following Thursday’s bullish falling wedge breakouts & subsequent rally, /NQ is approaching the bottom of a resistance zone that runs up to the downtrend line with most of the top components of QQQ currently trading at or near resistance in the pre-market session. 60-minute chart below.
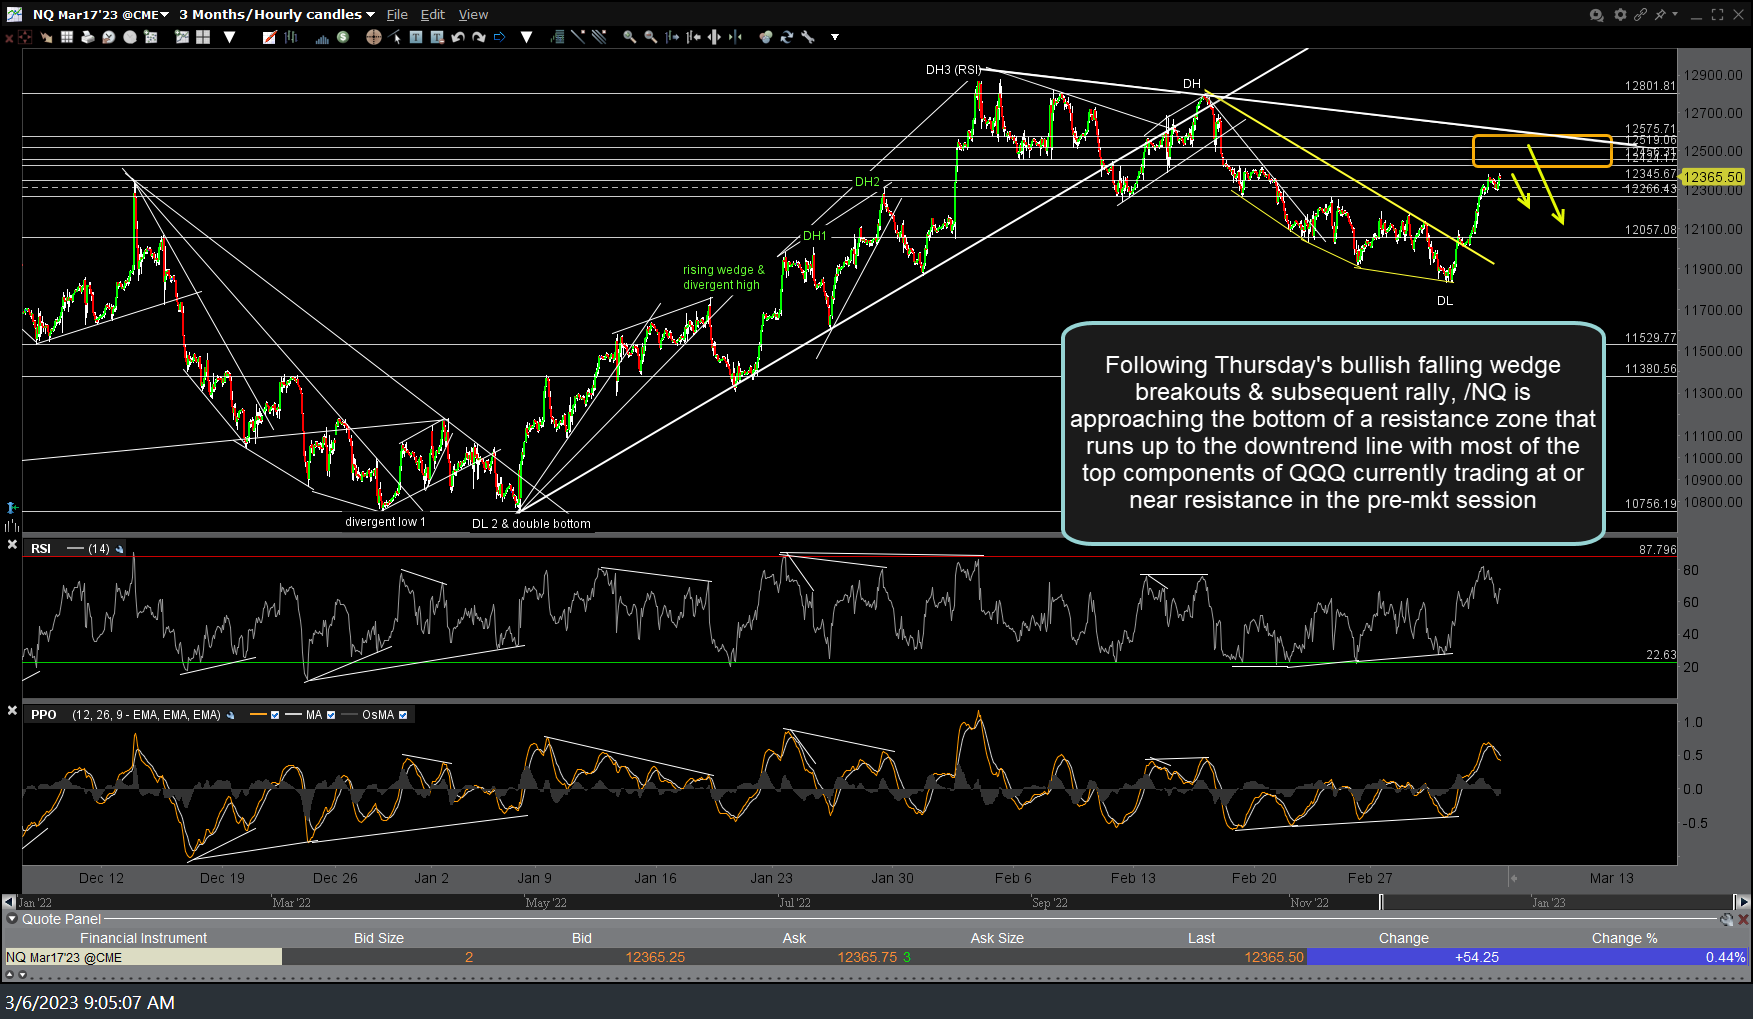
NQ 60m March 6th
QQQ is approaching the bottom off a resistance zone in the pre-market session that runs from about 301.50 up to 303 & the intersecting downtrend line, with a reaction likely. 60-minute chart below.

QQQ 60m March 6th
Bottom line: Last week’s breakouts above the bullish falling wedge patterns on the major large-cap indices was textbook, with a successful backtest followed by an impulsive rally Thursday, Friday, & into the pre-market session so far today. The indexes also successfully tested & rallied off key support levels on the more significant daily time frames last week (200-day SMAs, trendlines, etc..). As such, last week’s price action was 100% bullish so until & unless last week’s lows are clearly taken out, the bulls remain in control for now. However, I continue to suspect the markets will remain more conducive to actively trading than longer-term swing or trend positioning and it will likely continue to be a stock-picker’s market, with individual security selection (i.e.- going long the most bullish stocks & sector ETFs while short the most bearish) the best option for the less-active swing & trend traders.