
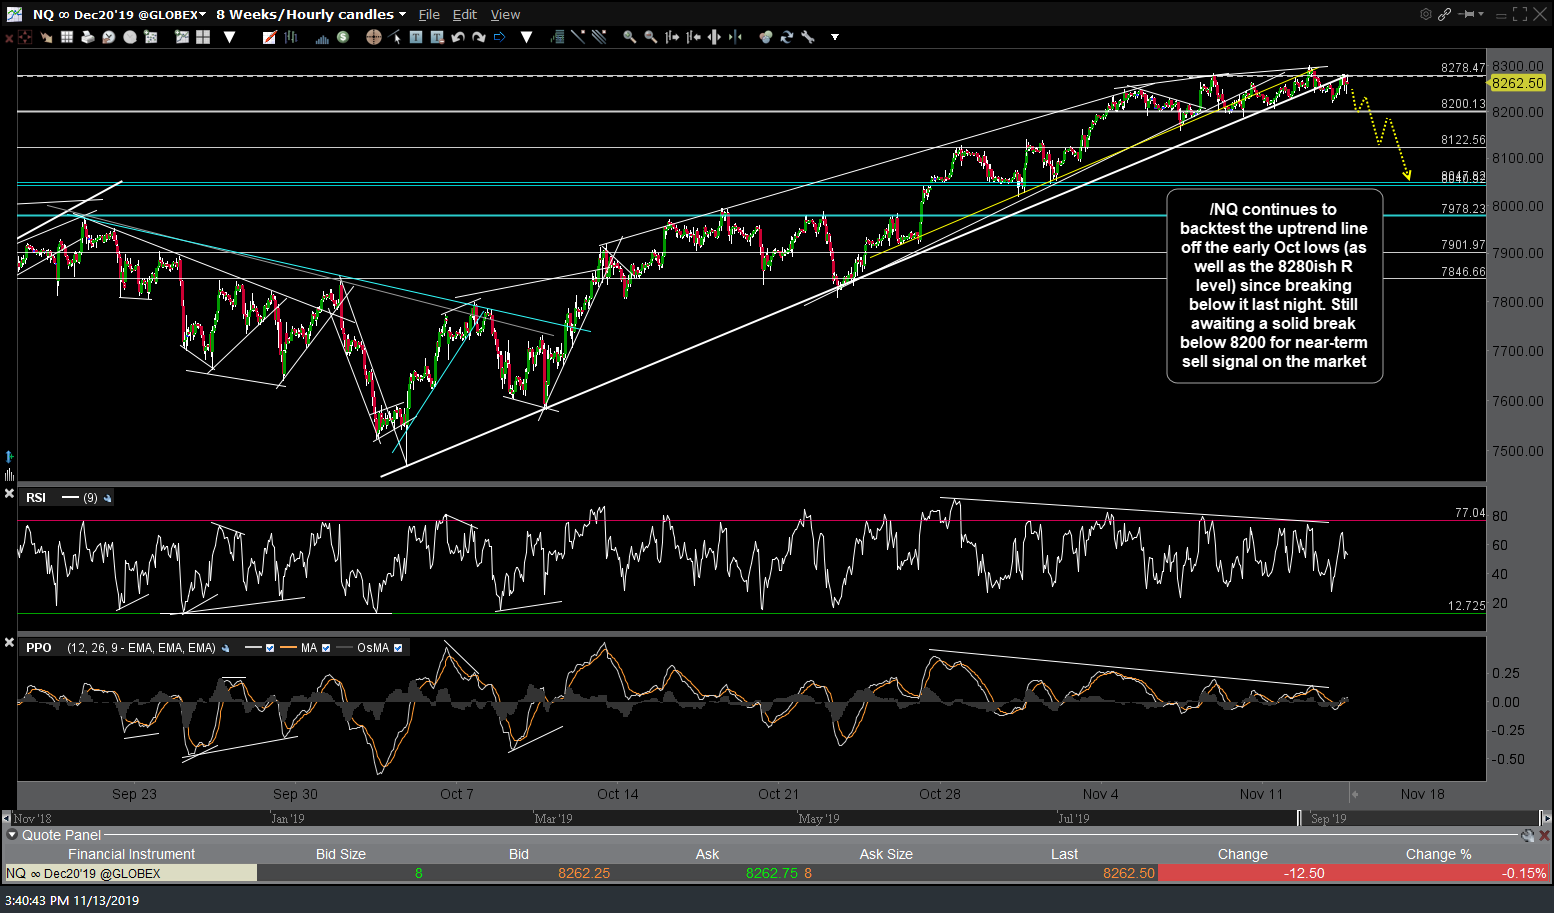
/NQ continues to backtest the uptrend line off the early Oct lows (as well as the 8278.50ish R level) since breaking below it last night. Still awaiting a solid break below 8200 for a near-term sell signal on the market.
NQ 60m 3 Nov 13th
The next chart is a zoomed-in view of the /NQ 60m chart showing multiple 60-minute candlestick backtests of the uptrend line + 8278.50ish resistance level so far since the trendline break last night.

NQ 60m 4 Nov 13th
Likewise, QQQ has broken down below the 60m uptrend line although not impulsively & has been bouncing between the 200.63 support & the trendline from below (backtesting) so far. Ideally, QQQ needs to take out 199.80 with conviction to open the door to a correction down to my 195.70-194.40 target zone.

QQQ 60m Nov 13th
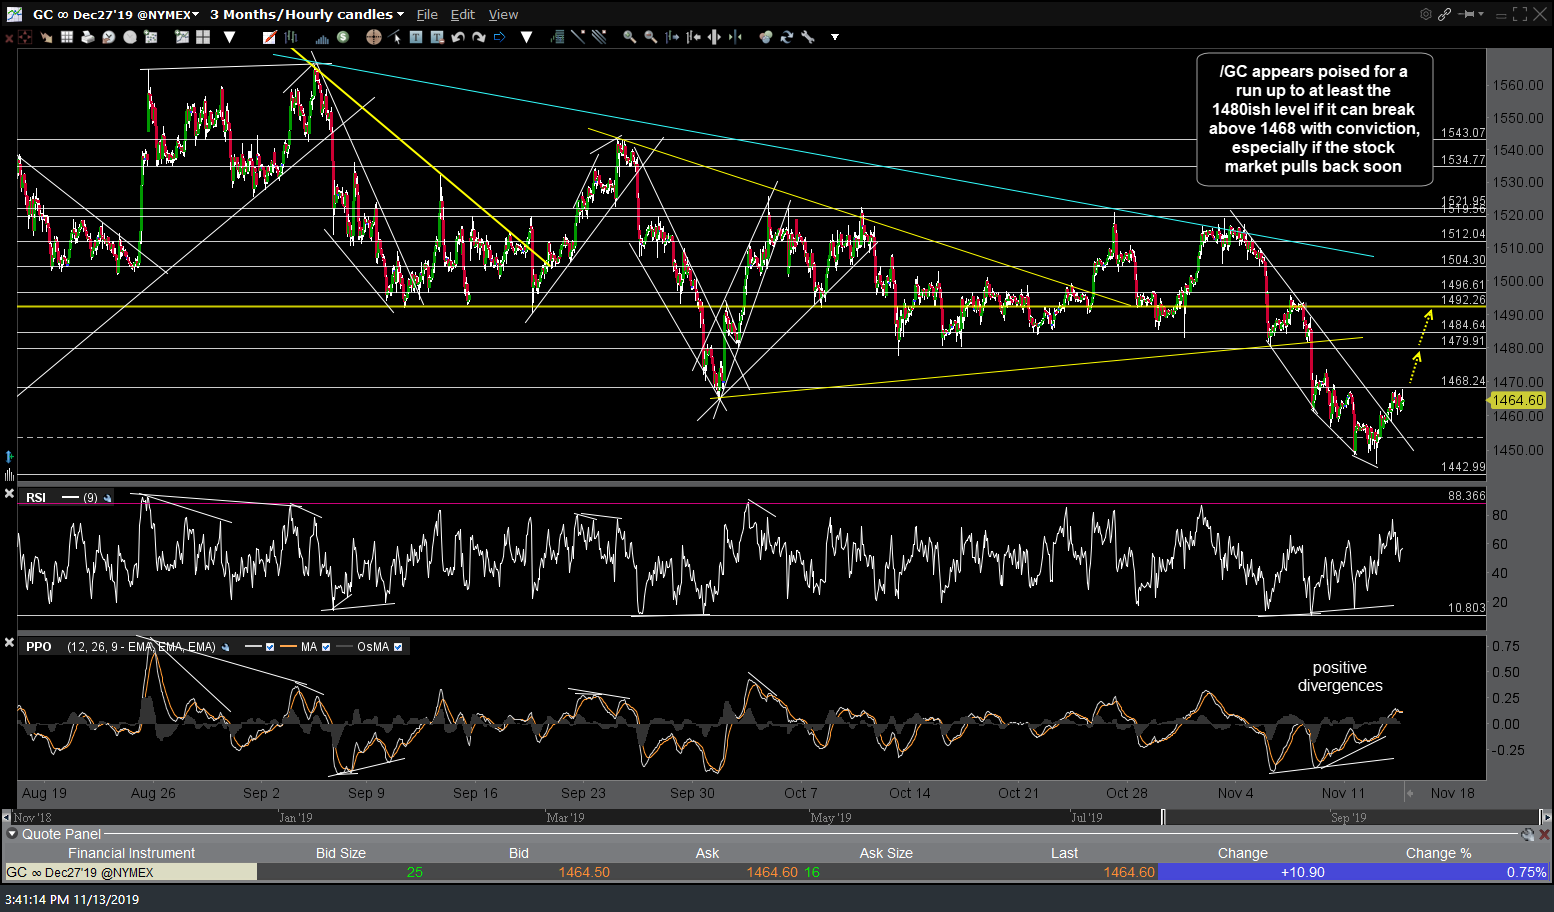
Should we get the more significant sell signals with solid breakdowns below /NQ 8200 & QQQ 199.80 soon (also look for impulsive rejections off the backtests of these trendlines), that would likely spark additional upside in the risk-off assets which should provide for at least a short-term tradable rally. /GC (gold futures) appears poised for a run up to at least the 1480ish level if it can break above 1468 with conviction, especially if the stock market pulls back soon. GLD is the ETF for gold.
GC 60m Nov 13th
/ZB (30-yr Treasury bond futures) and TLT (20-30 yr T-bond ETF) appear poised for at least a minor rally if they can take out the recent highs with conviction, especially if we get a pullback in the stock market soon.

ZB 60m Nov 13th