
/ES (S&P 500 futures) continues to test the uptrend line off the mid-June lows with a buy signal to come on a breakout above this 60-minute bullish falling wedge pattern (blue lines).
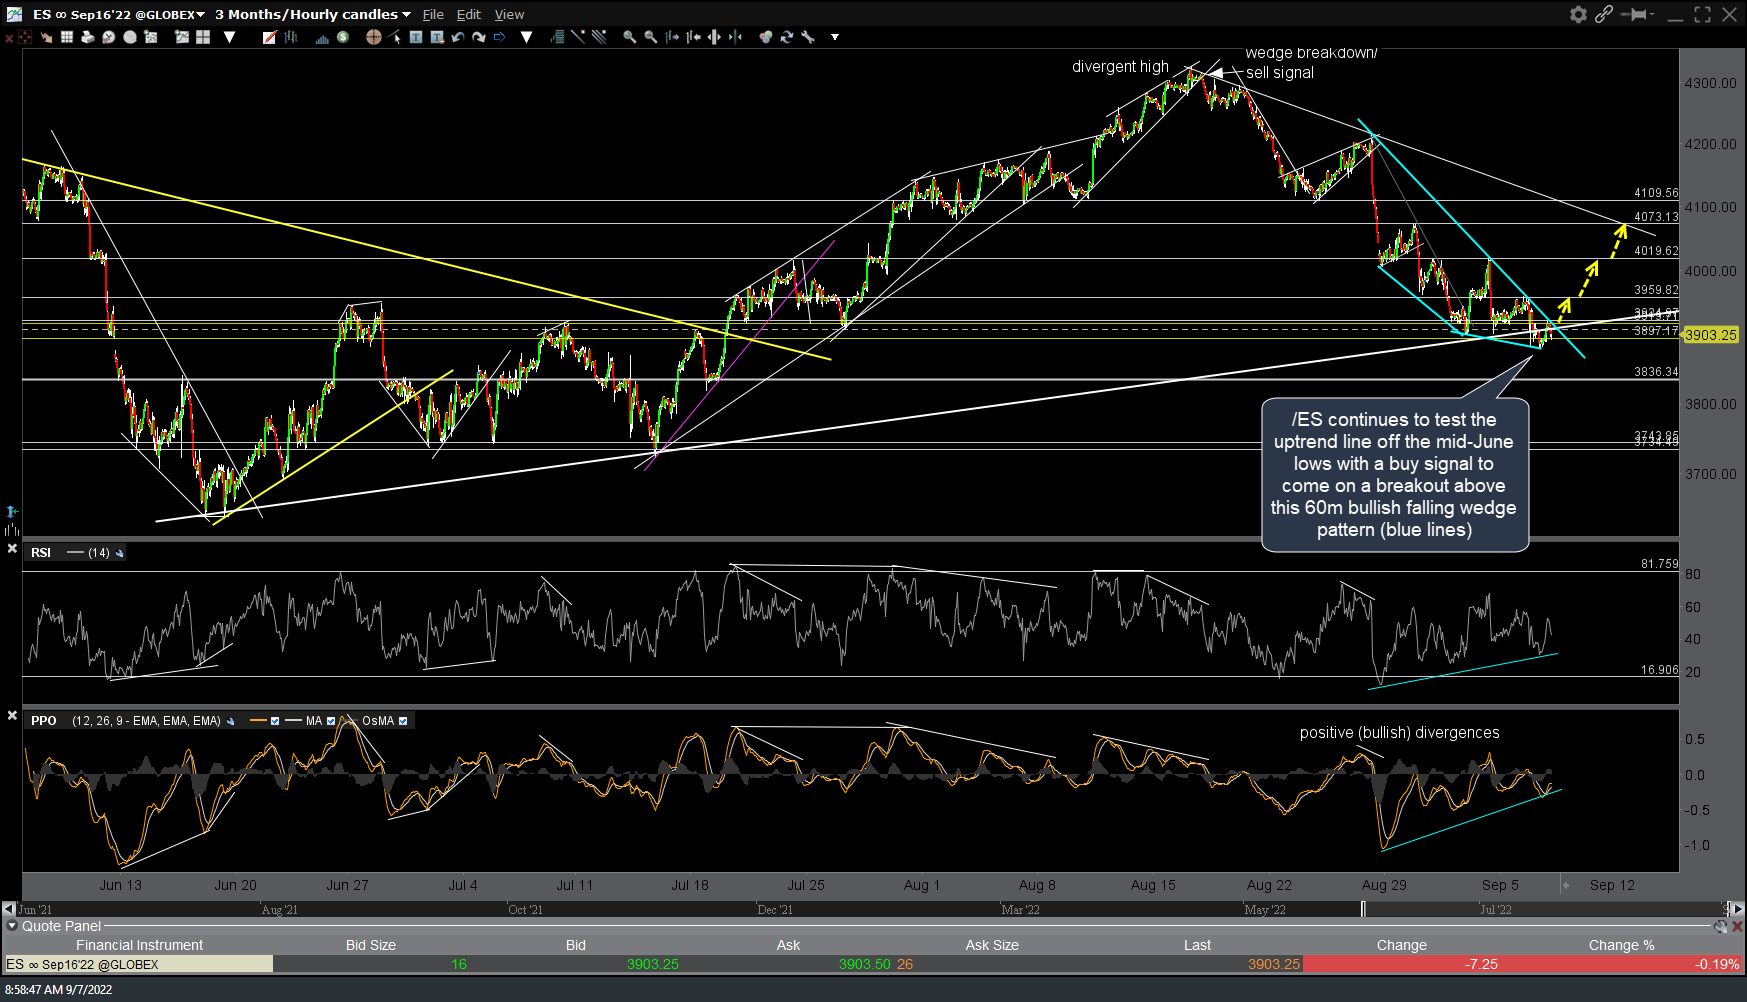
ES 60m Sept 7th
Likewise, a buy signal on /NQ (Nasdaq 100) would come on a solid break above this bullish falling wedge pattern (blue) & the 12060 resistance level on this 60-minute chart.
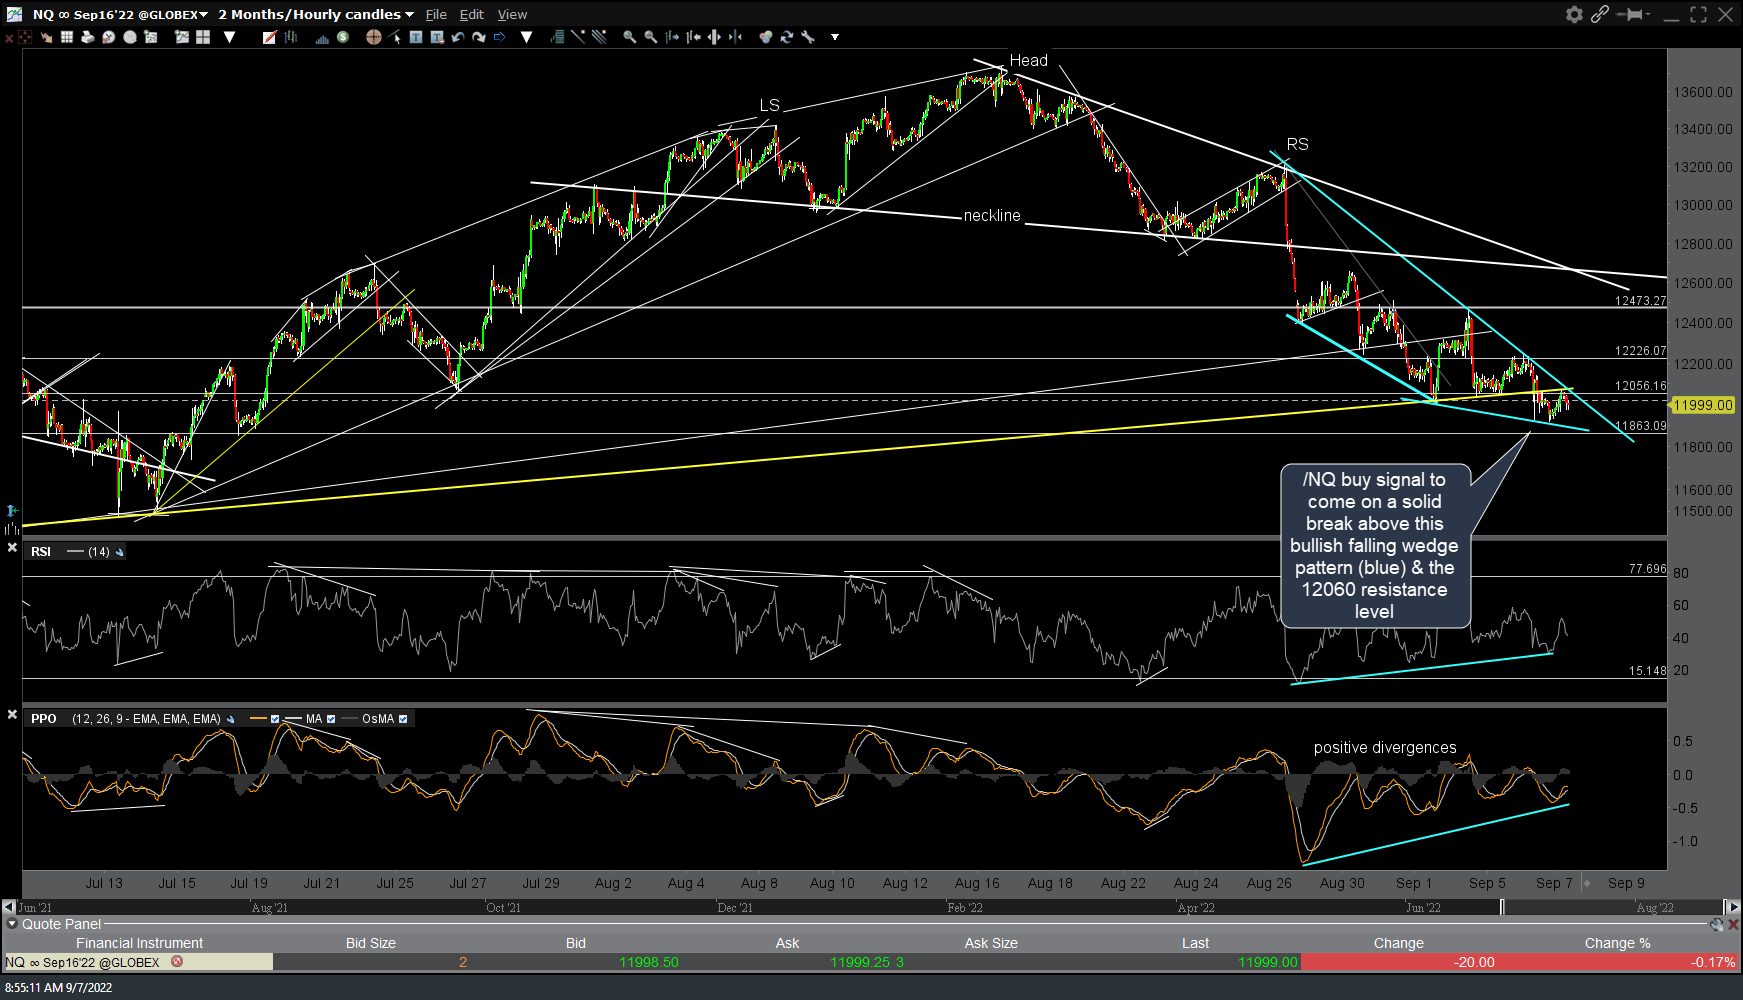
NQ 60m Sept 7th
It should go without saying but still bears repeating: Ideally, you want to see both /NQ & /ES make solid breakouts & 60-minute candlestick closes above these wedges. As the market continues to test key support, a solid drop & especially a solid daily close below the recent lows would be bearish & likely open the door to the next wave of selling. Stay nimble & open to all possibilities and best of luck on your trades!