
As the stock index futures provide more visibility due to the round-the-clock trading (i.e.- more candlesticks to identify price & trend line support levels), I prefer to use the charts of the futures vs. the index ETFs for analyzing the near-term direction. Additionally, with some big potentially market-moving earnings on deck for tonight, including AAPL, INTC, V, & KLAC, these 15-minute charts below might provide some clues to where the stock market goes today with both /ES (S&P 500) and /NQ (Nasdaq 100) sandwiched between the near-term uptrend lines (support, which would provide a sell signal if/when broken) and the technically significant & unusually large gaps from Sunday evening (resistance).
/NQ sell signal to come on a solid break below this (and /ES) uptrend line. Should /NQ push up slightly higher to test the bottom of the Sunday evening gap, it would simply extend the existing divergences/ rising wedge that are currently in place.
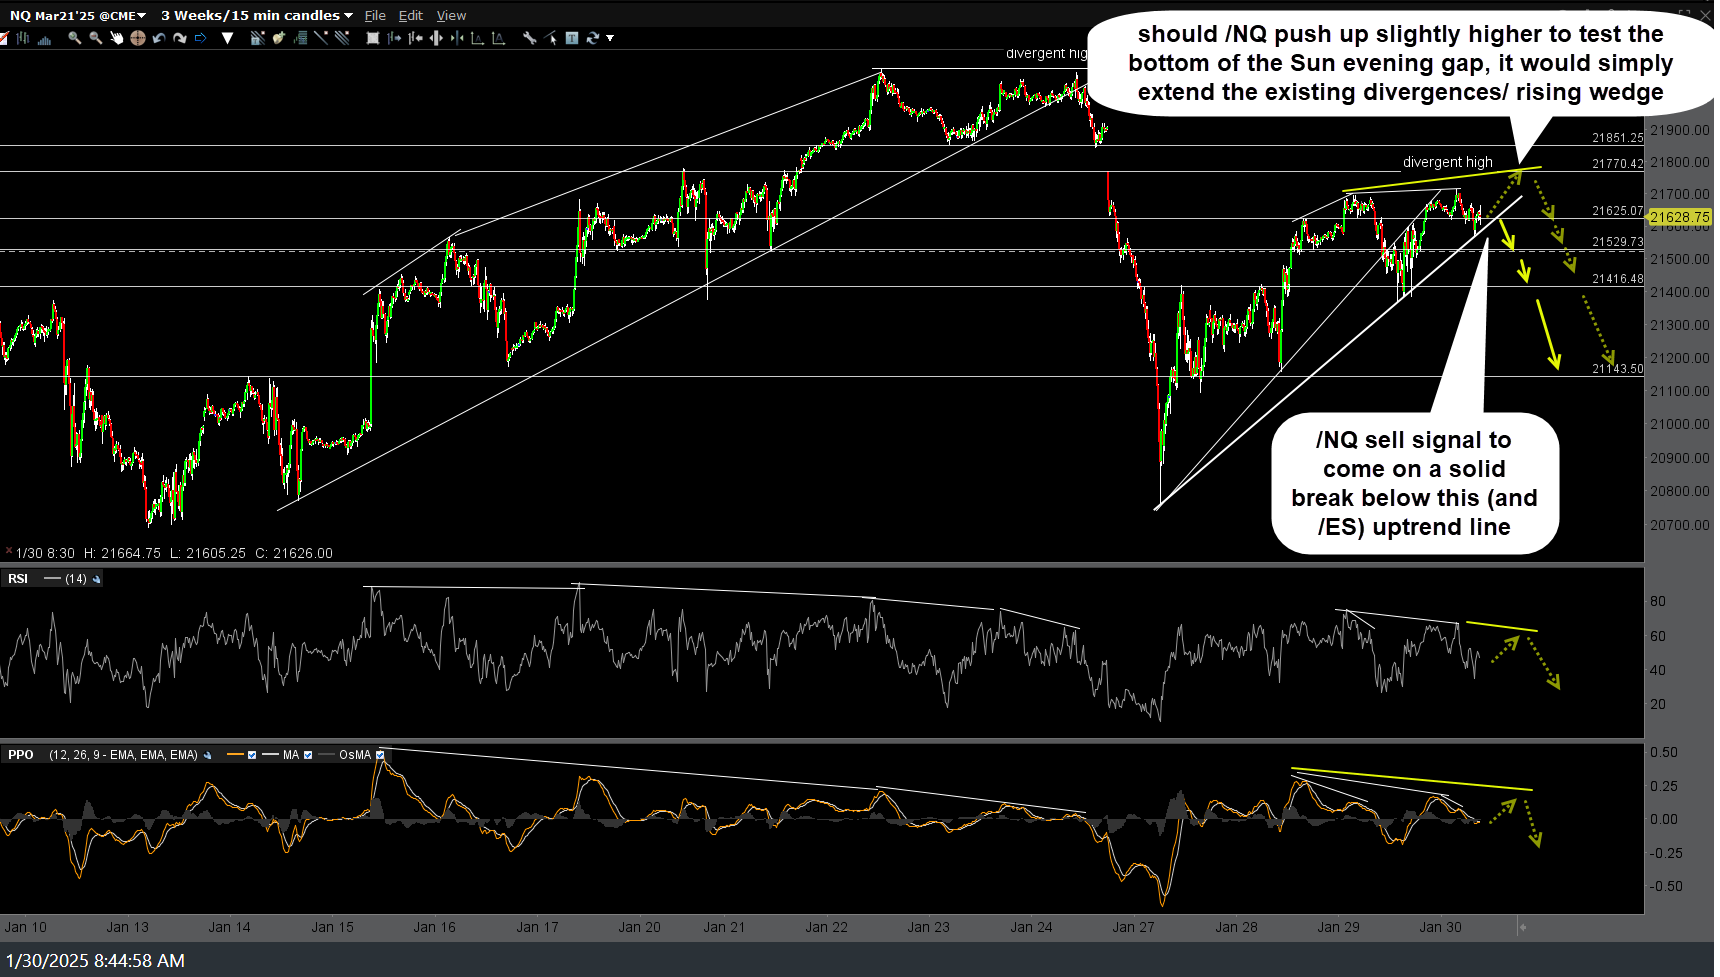
NQ 15m Jan 30th
Ditto for /ES. Should both /NQ & /ES solidly take out the tops of Sunday evening’s gaps, that would most likely lead to marginal but still divergent highs on all time frames from the 60-minute charts out to the weekly charts & even monthly charts.
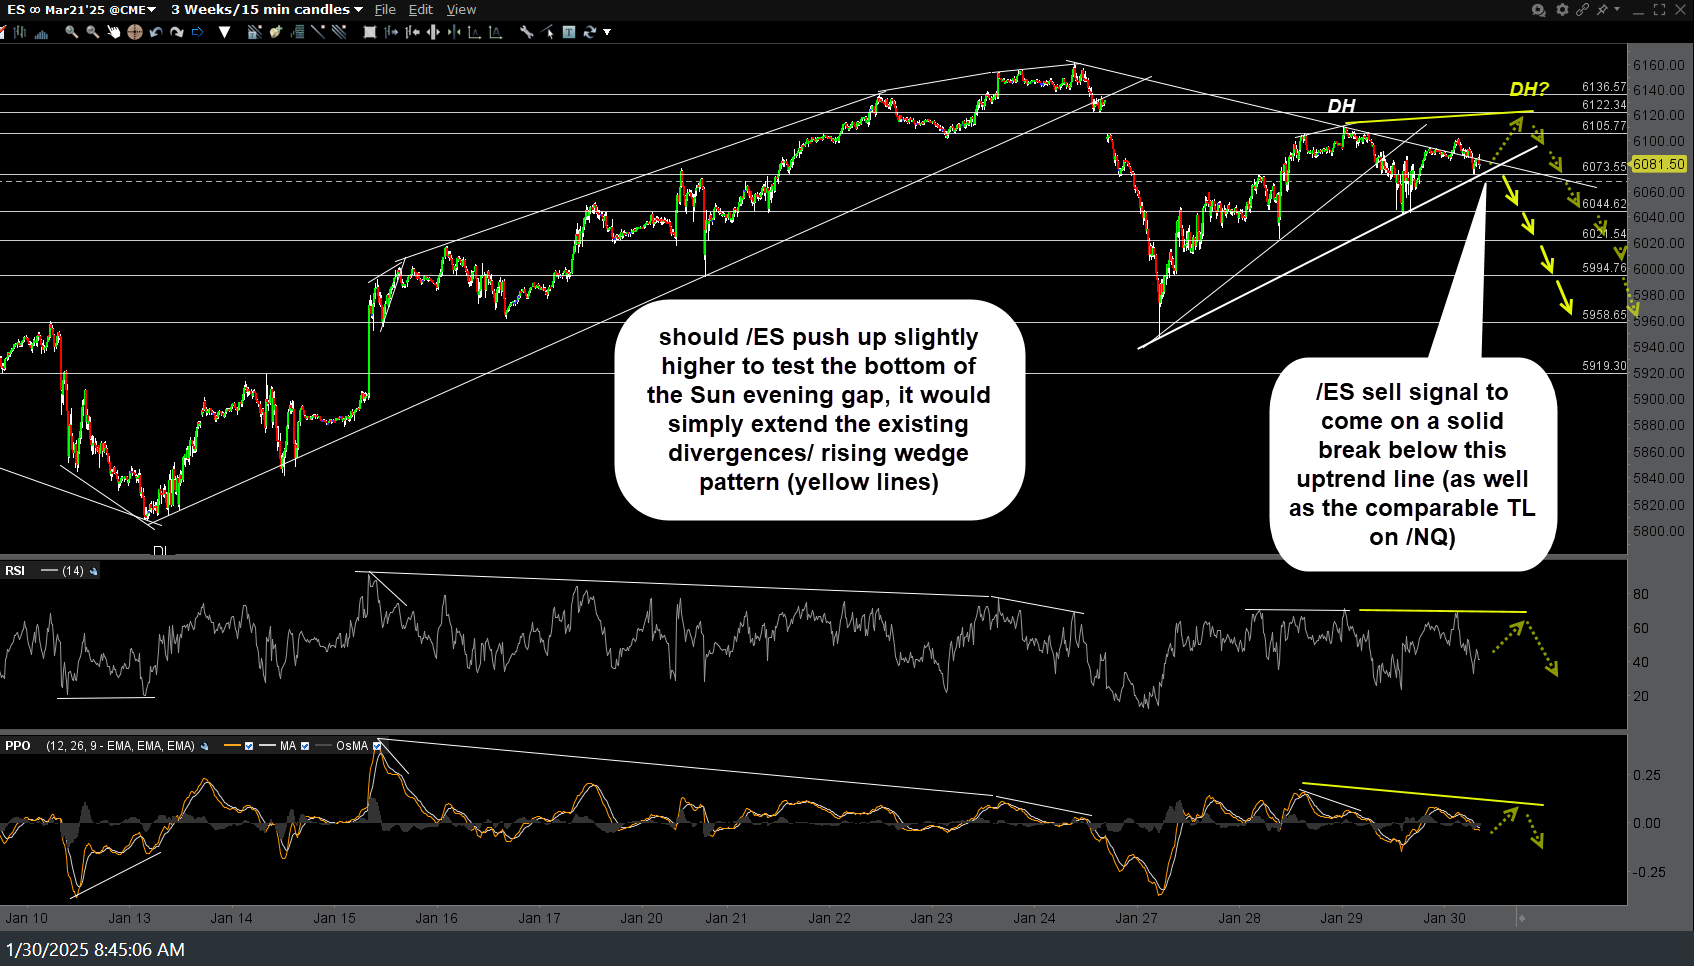
ES 15m Jan 20th