
Following what I refer to as a “wedge overthrow” (or over-shoot), both /ES & /NQ have triggered sell signals on breakdowns below the 60-minute wedges/uptrend lines posted earlier today. Both made wedge “overthrows” followed by an impulsive drop back down into & below the wedge, thereby triggering a sell signal on the major stock indices.
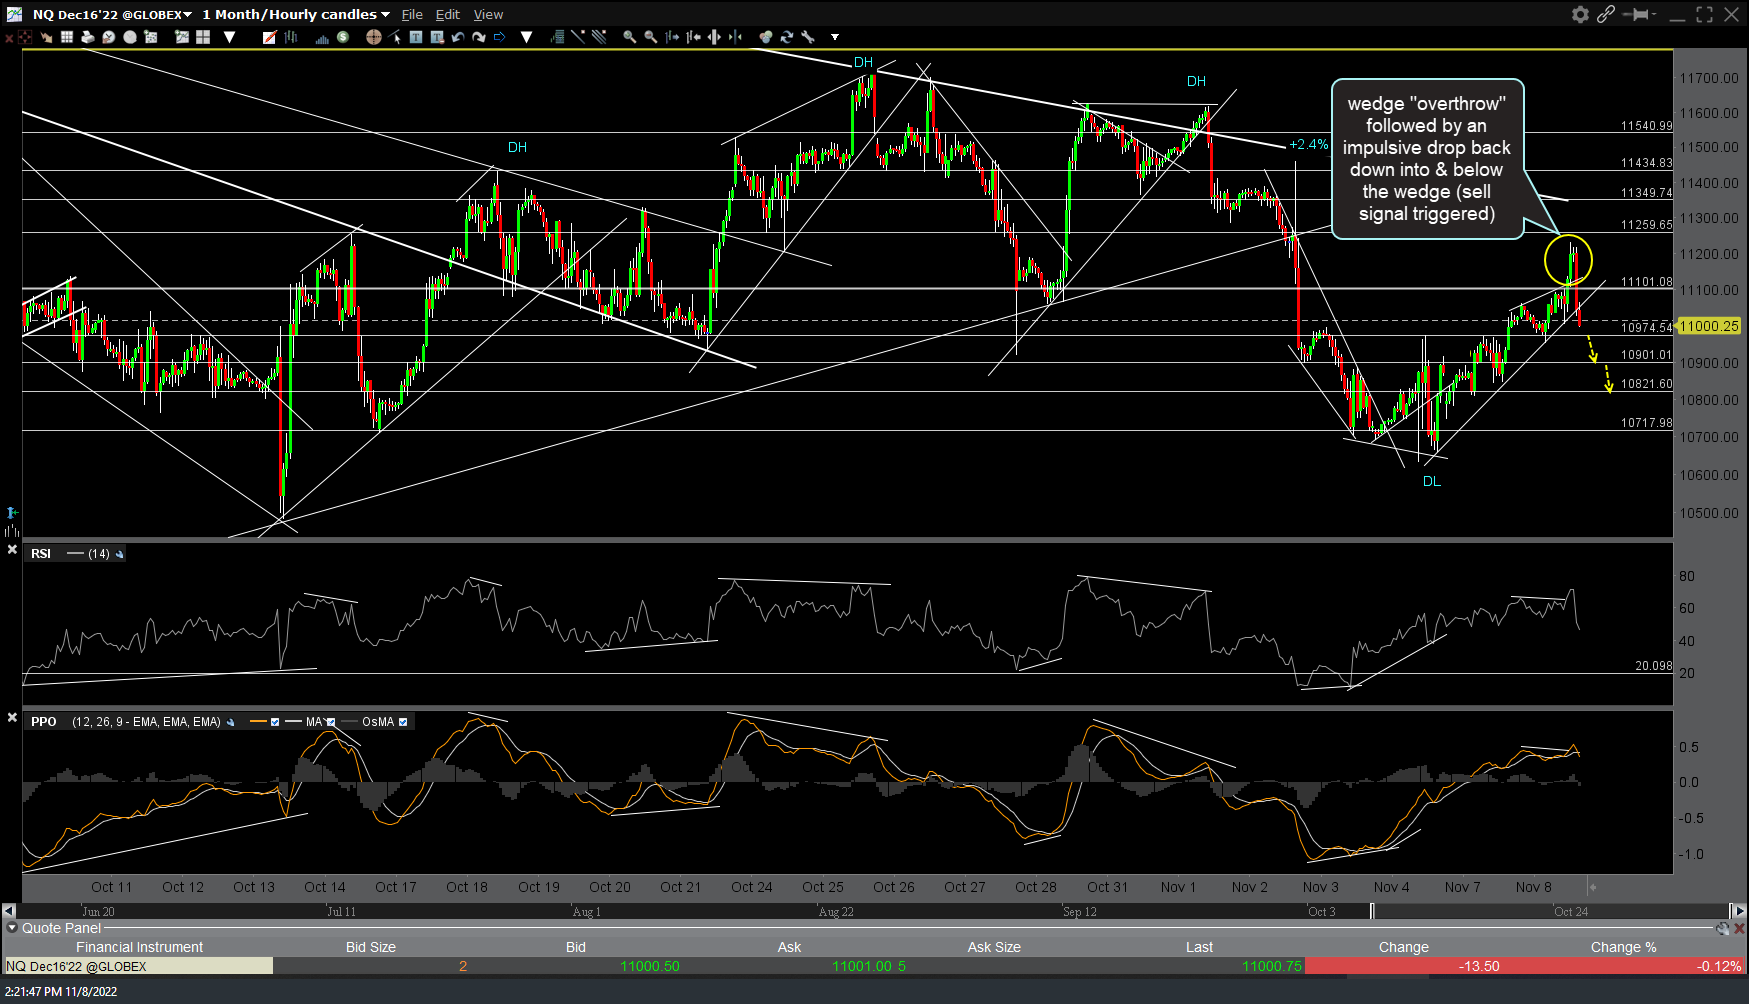
NQ 60m 2 Nov 8th
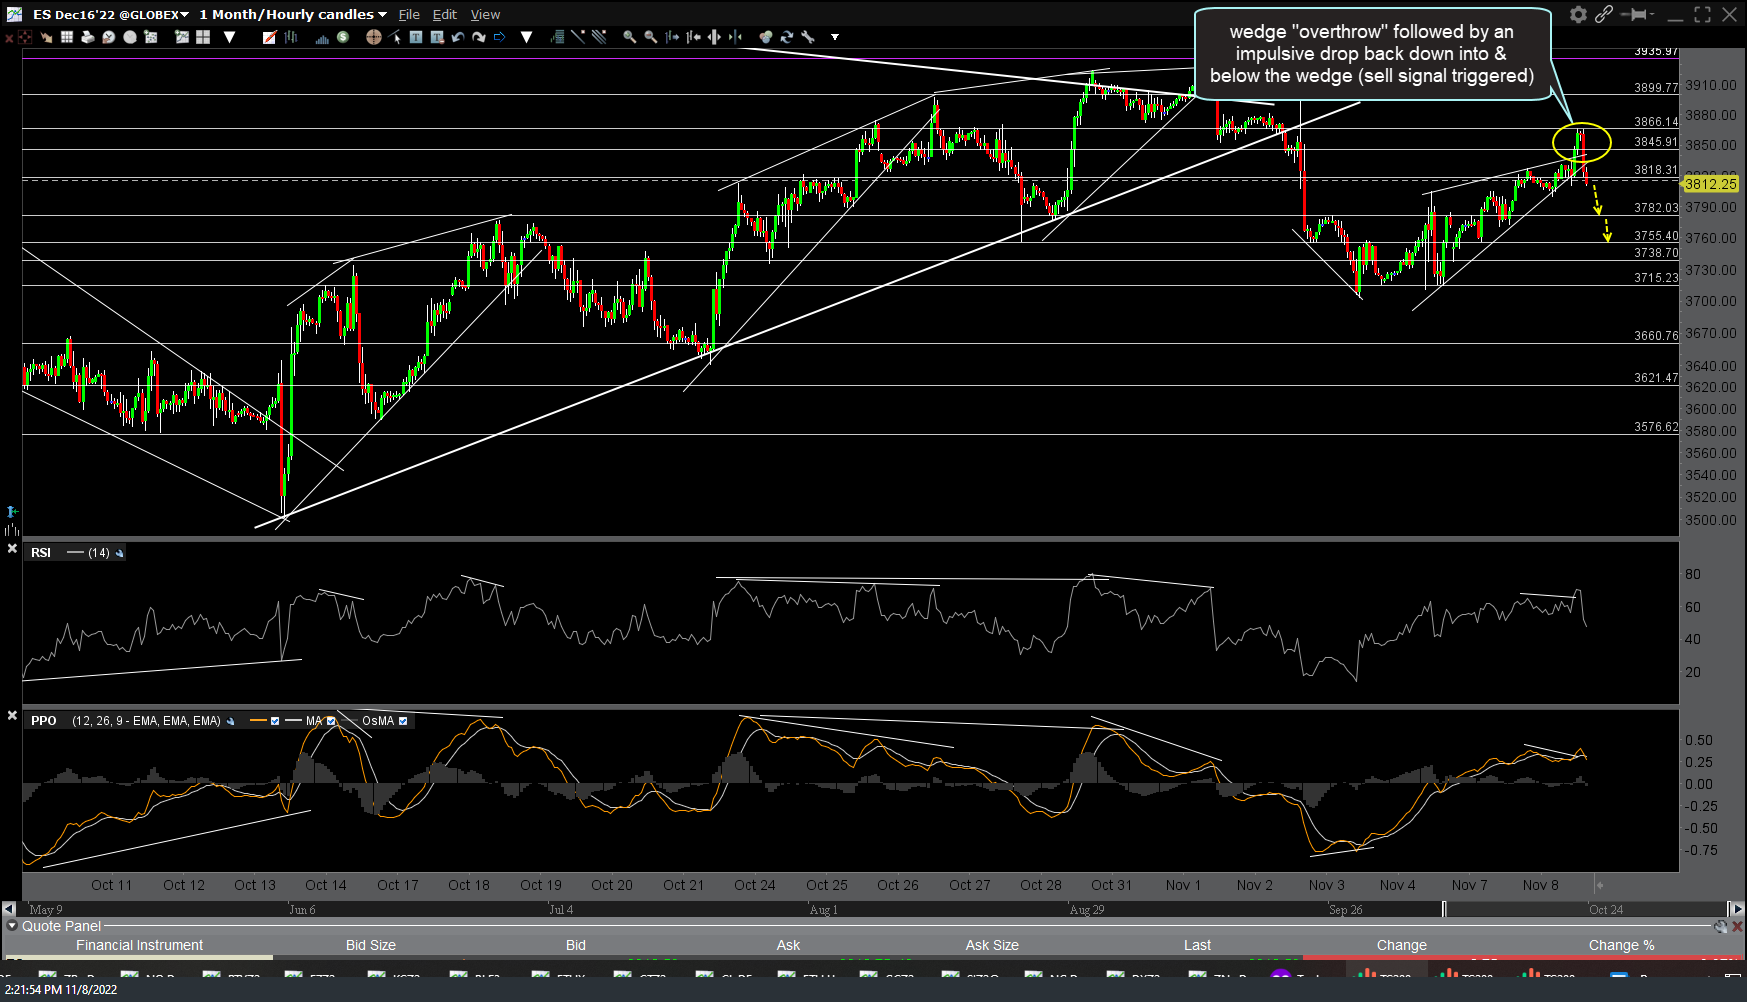
ES 60m 2 Nov 8th
Wedge overthrows are a term I use for a fairly rare setup whereby I’ll be monitoring either a bullish falling wedge pattern or, as in this case, a bearish rising wedge pattern & right around the point where the wedge pattern will typically breakout (roughly 70-80% towards the apex of the wedge), instead of the typical breakout above (on a falling wedge) or below (rising wedge), the opposite happens with an impulsive, near vertical spike below (above) the wedge immediately followed by an equally impulsive move back down (or up) into the wedge and out the other side (i.e.- in the direction the pattern was expected to break).
The first support levels located just below the wedges (where a reaction is likely upon the initial tag) are roughly /NQ 10974 & /ES 3782. As such, the odds of these breakdowns “sticking” will increase substantially on both solid 60-minute candlestick closes below the wedges (on both) & then 60-minute closes below those first nearby price support levels. As I type, we’re still working on the initial (60-minute) breakdown candle which will be finalized at 3:00 pm EST. For those that don’t want to wait for confirmation via a 60-minute close, any intra-period (60-minute) backtest of the wedges would also provide an objective entry with stops somewhat above the uptrend lines.