
/NQ )Nasdaq 100 E-mini futures) has already fallen 3% since the sell signal/breakdown below the price channel & 4% off the divergent high just before that… the largest drop in months. /NQ is testing uptrend line support that, if broken, would likely bring it down to the top of my preferred swing target zone at 8890 although much below that could take out the divergences & bring the index to the bottom of my target zone at 8694.
-
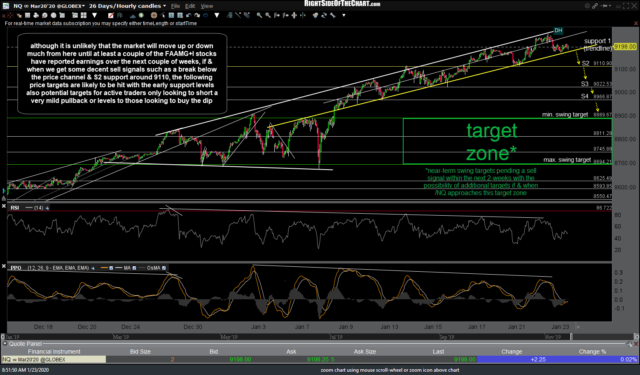
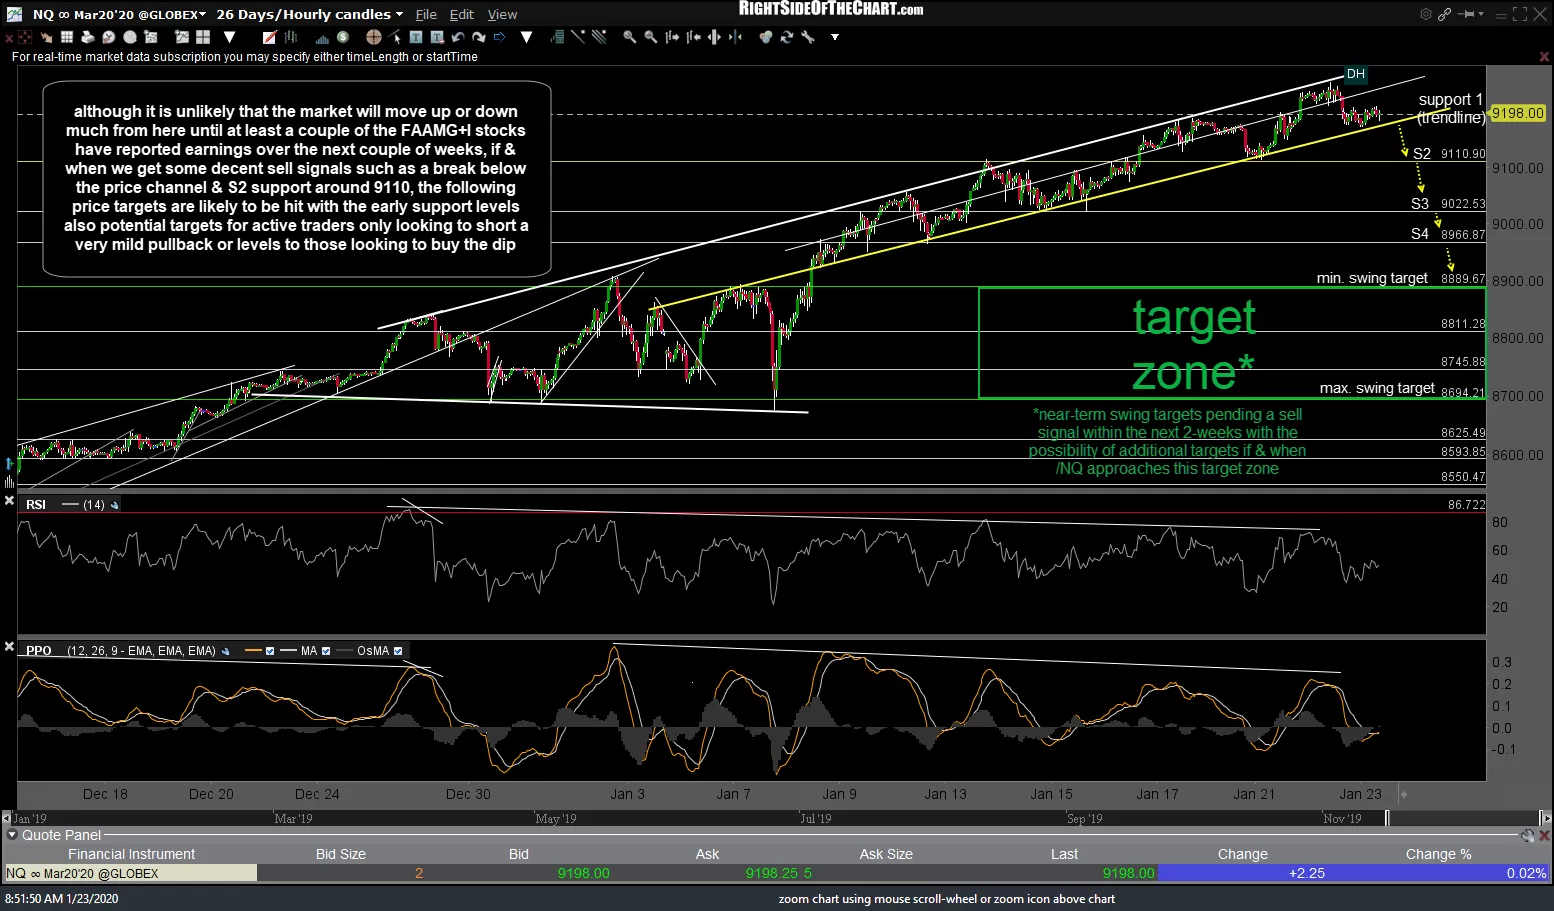
- NQ 60m Jan 23rd
-
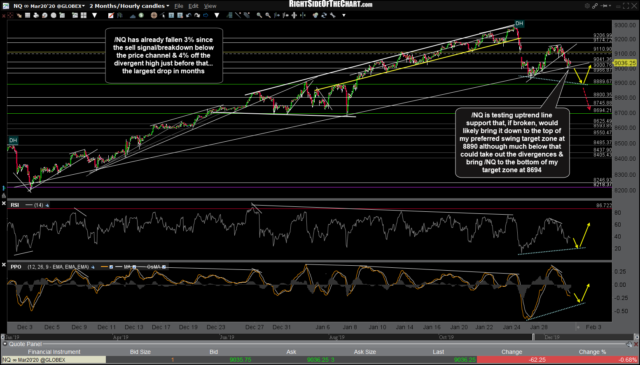
- NQ 60m Jan 30th
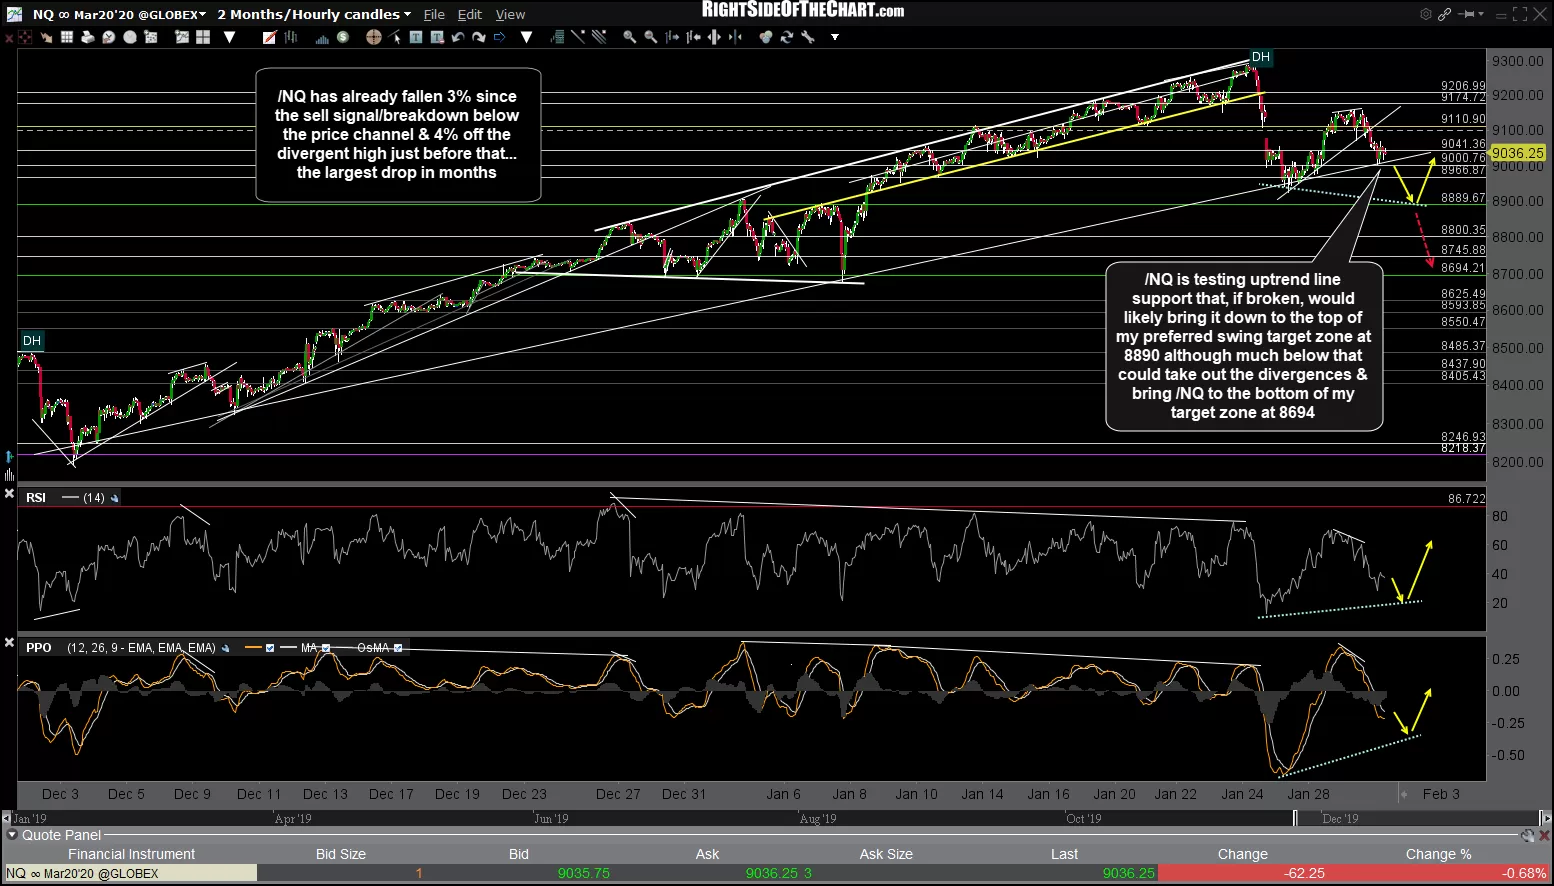
The first chart above is the 60-minute chart posted exactly one week ago today, outlining that target zone as well as the catalyst/trigger for the sell signal, which would come on a break below the price channel & 9111, the first of which was taken out impulsively last Friday followed by another impulsive leg down to take out the 9110 support on the gap down on Sunday evening. As of now, I still favor more downside to at least the top of my target zone (8890) although /NQ is trading on a pretty significant uptrend line support right now & would need to take it out with conviction to provide the next sell signal & objective short entry or add-on. As I like to say: Support is support until & unless broken.
/ES (S&P 500 futures) is starting to crack below trendline support with the 3224-3232 support/target zone just below followed by the 3190-3202 zone. A little more downside on /ES may put in a divergent low unless it continues down much below 3224 to take out the divergences. 60-minute chart below.

ES 60m Jan 30th
/RTY (Russell 2000 Small-cap futures) has the potential to put in a divergent low on or around the 1624 or 1610 support levels, should it move a bit lower & reverse from there. I favor a continued move down to at least the 1624.25 support and put decent odds on a larger drop to the 1610 support, assuming /NQ clearly breaks below the aforementioned uptrend line support.
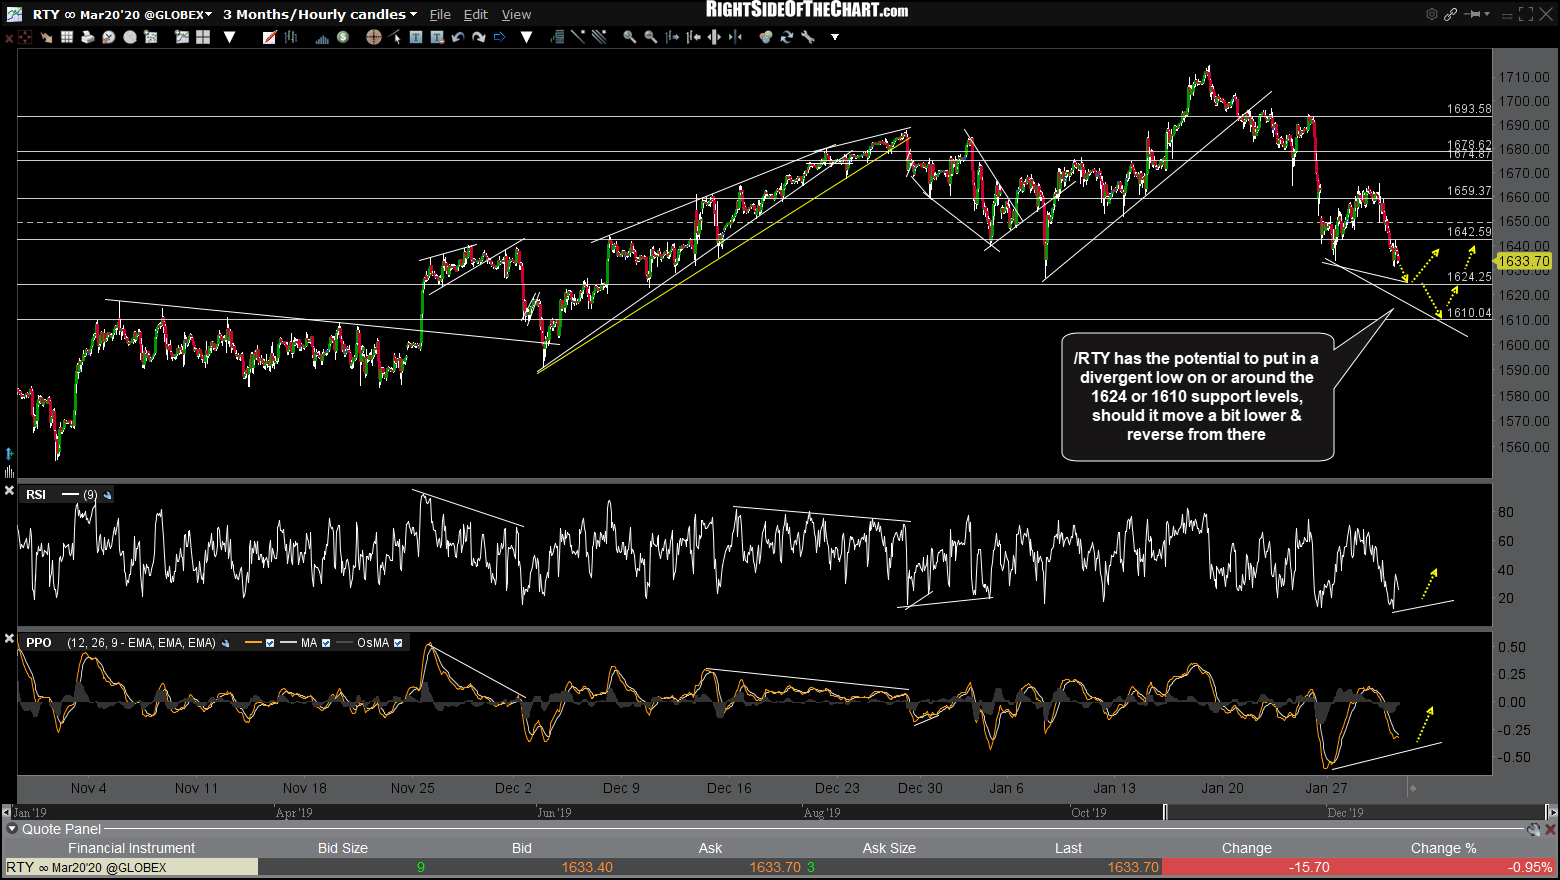
RTY 60m Jan 30th