
/ES (S&P 500 E-mini futures) sell signal triggered on a break below the 60-minute rising wedge pattern followed by an impulsive drop with the 2882.75 support level just below. The broad market continued to grind around with /ES essentially trading where it was over 3-weeks ago back on the April 16th divergent high.
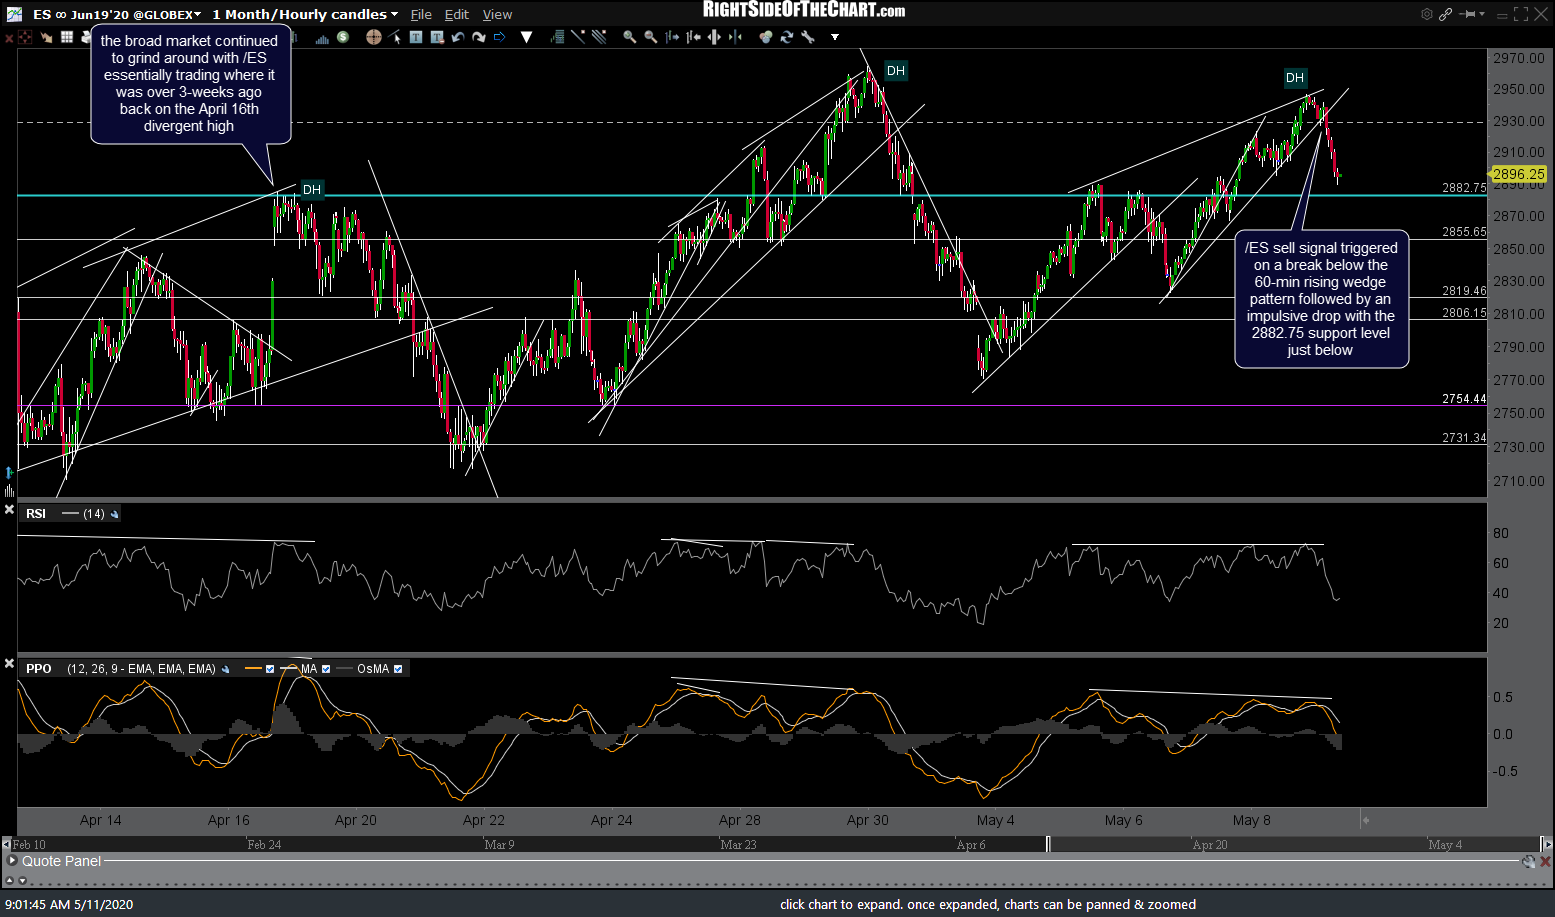
ES 60m May 11th
/NQ (Nasdaq 100) has also broken down below the uptrend line/wedge off the May 3rd lows with the next sell signal to come on a solid break below the 9111 support. A bearish cross of the PPO signal line (9-ema) below the zero line would indicate a change of the near-term trend from bullish to bearish. I’ll follow up with some charts of QQQ & SPY in the comment section below this post after the regular session is underway.
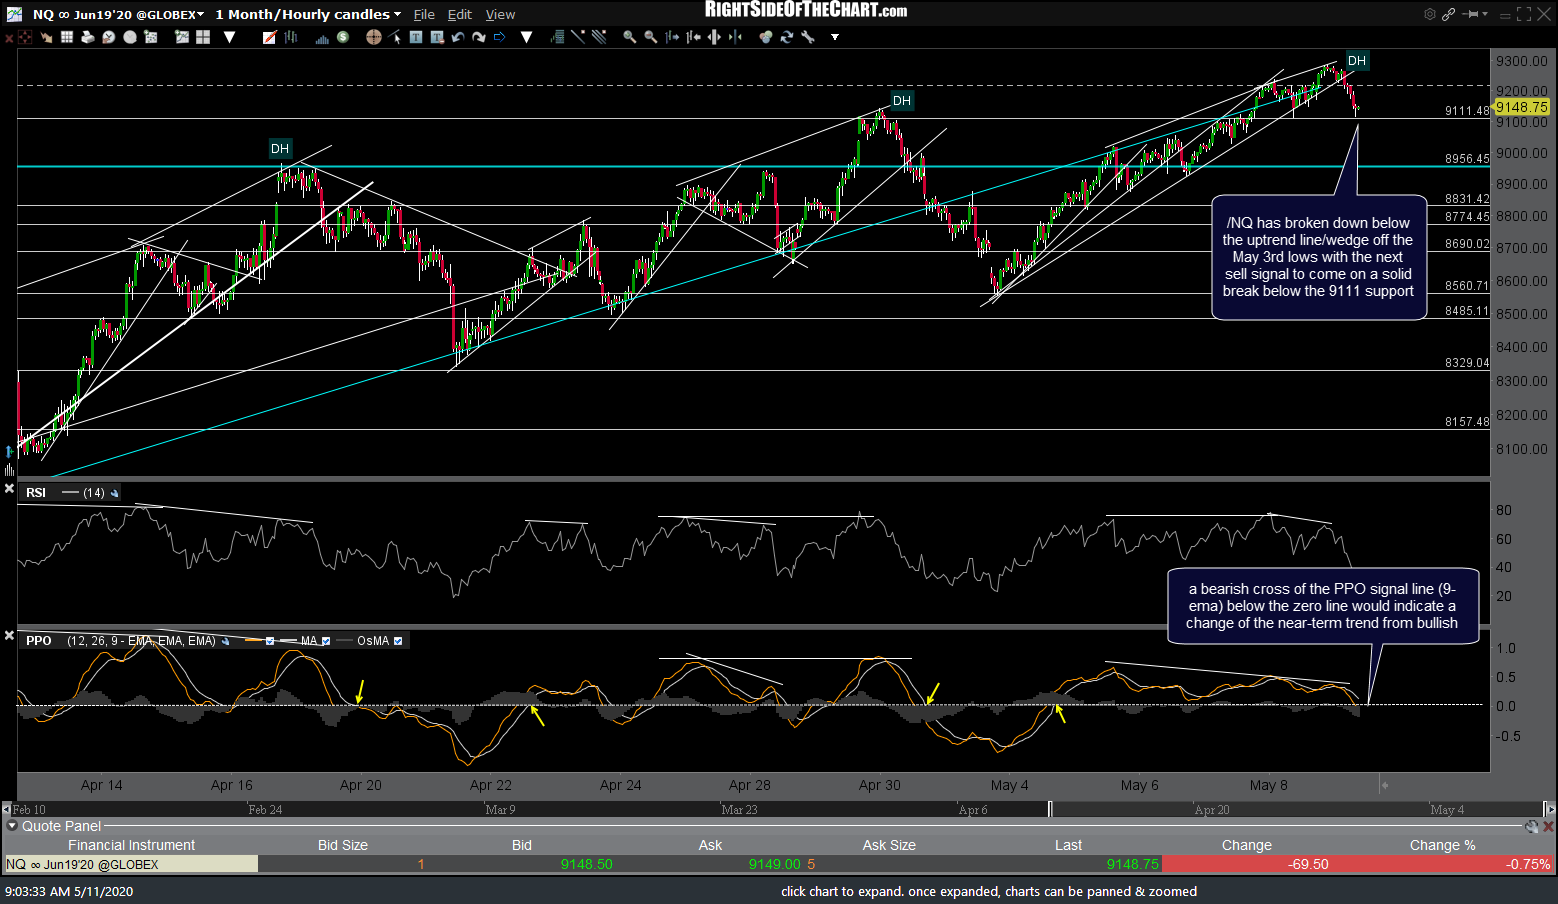
NQ 60m May 11th