
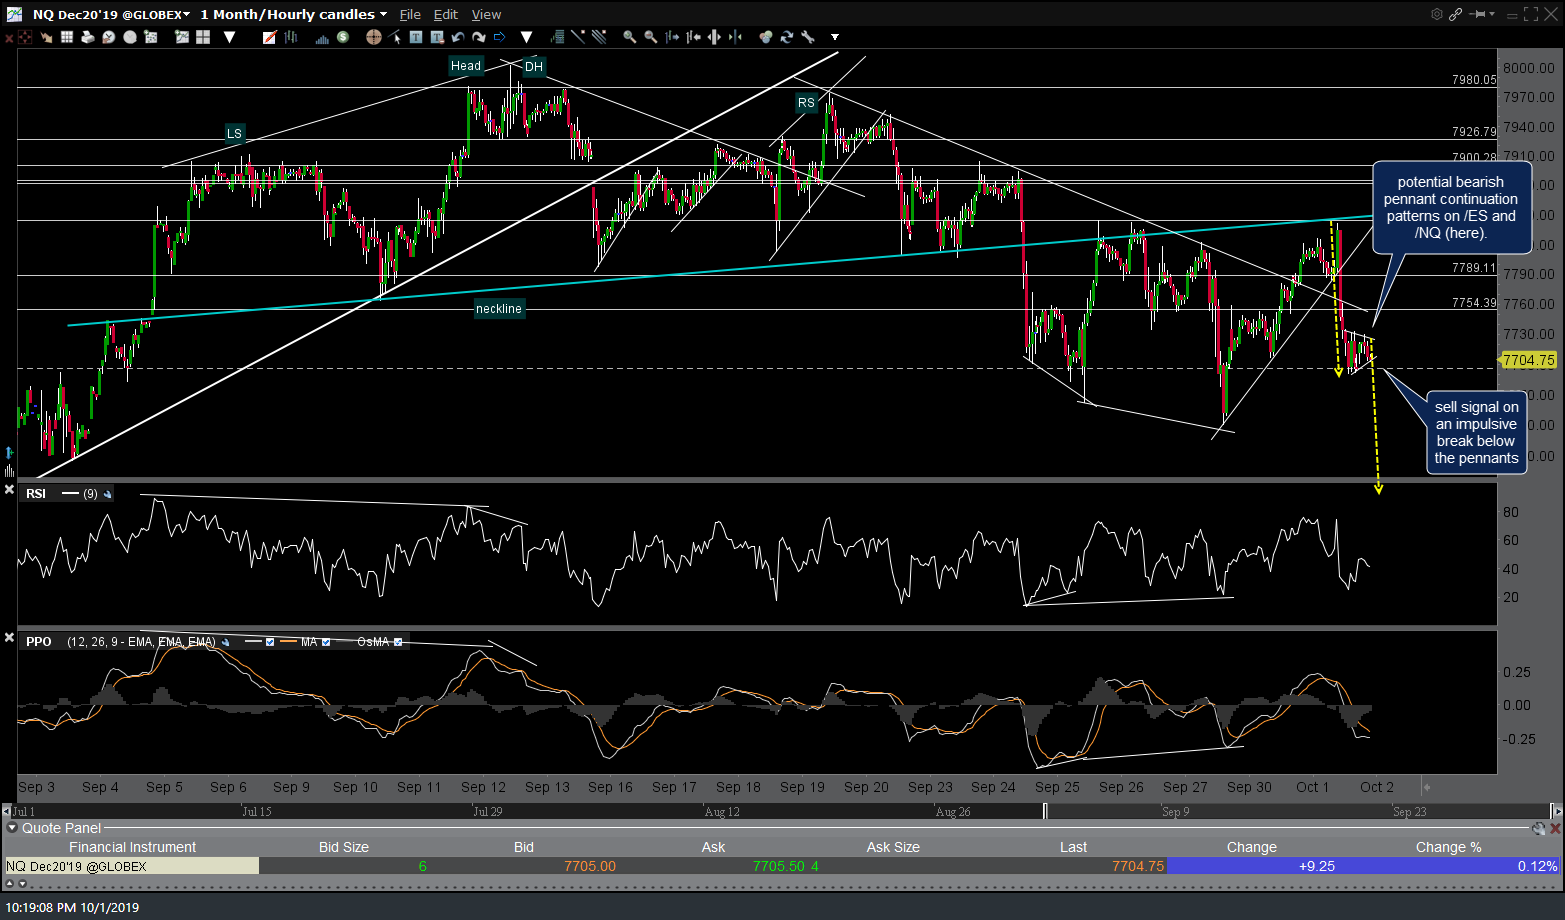
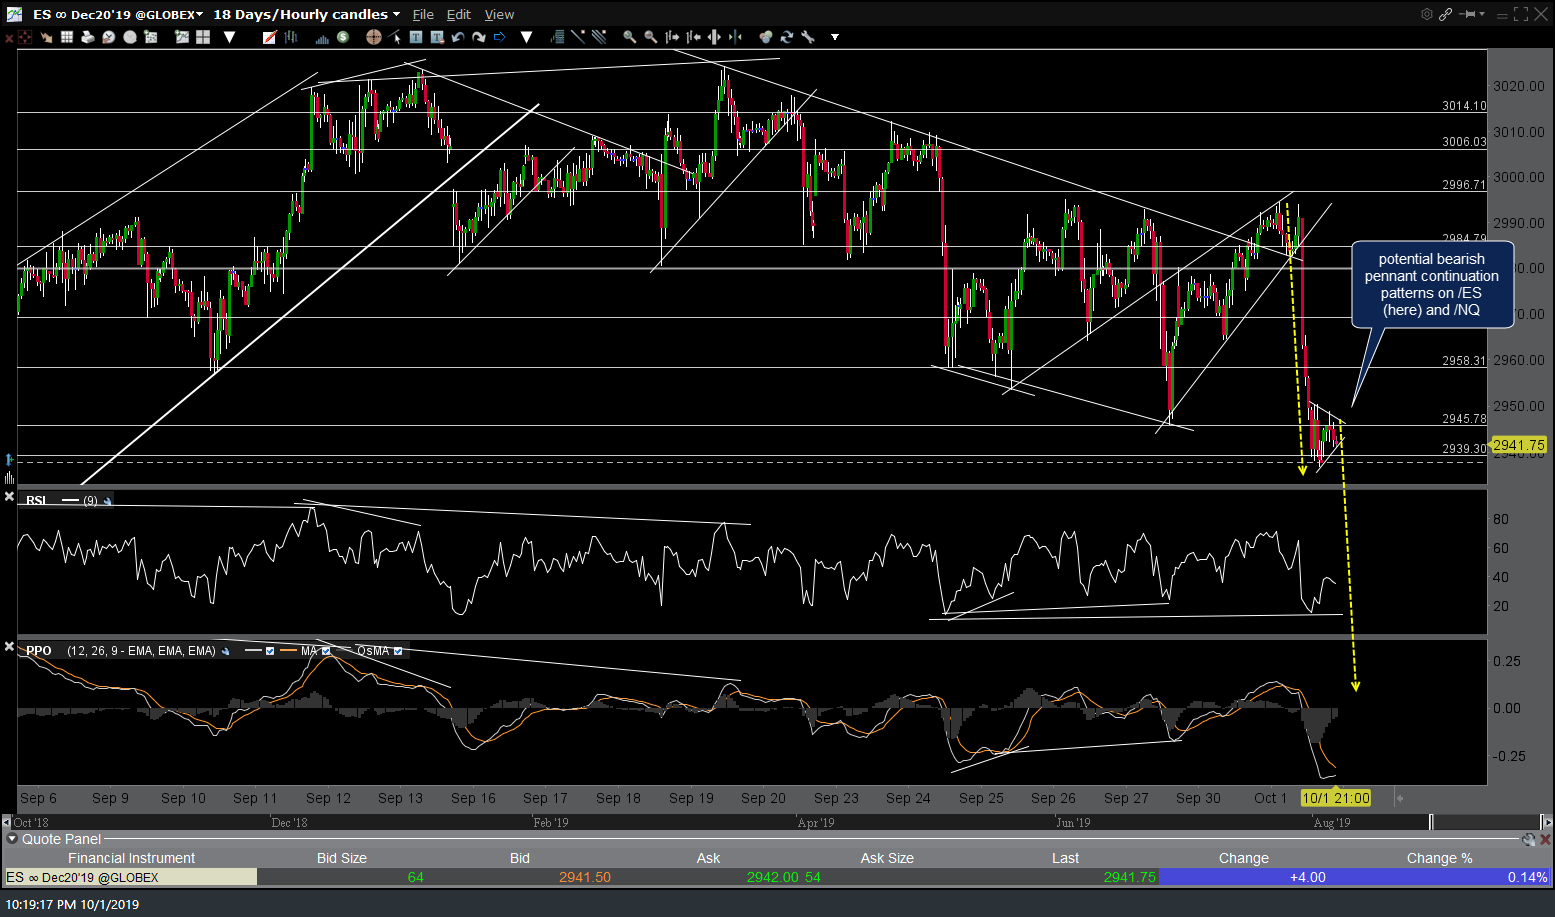
While I don’t make a habit of posting analysis & trade setups late in the evening, I did make a point to post a pair of bearish pennant patterns in the trading room (first charts below) that were forming on both /ES (S&P 500 futures) and /NQ (Nasdaq 100 futures) around 10:30 pm EST last night. Both patterns did go on to trigger a sell signal on a breakdown shortly afterwards, followed by ‘textbook’ impulsive legs down in both /NQ & /ES.
-

- NQ 60m 5 Oct 1st
-

- ES 60m 4 Oct 1st
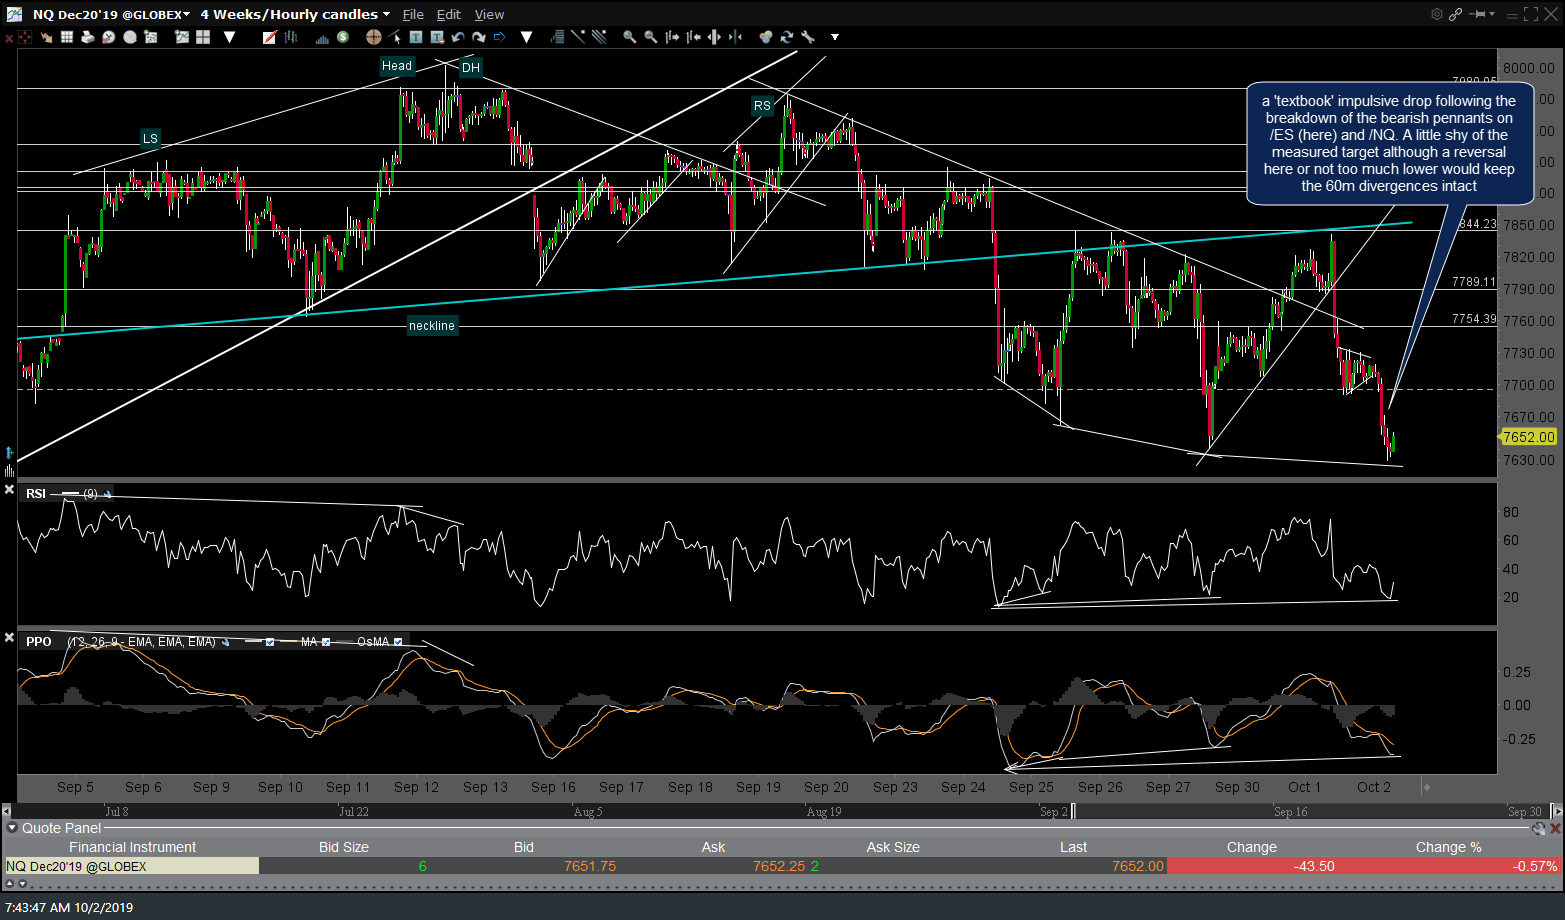
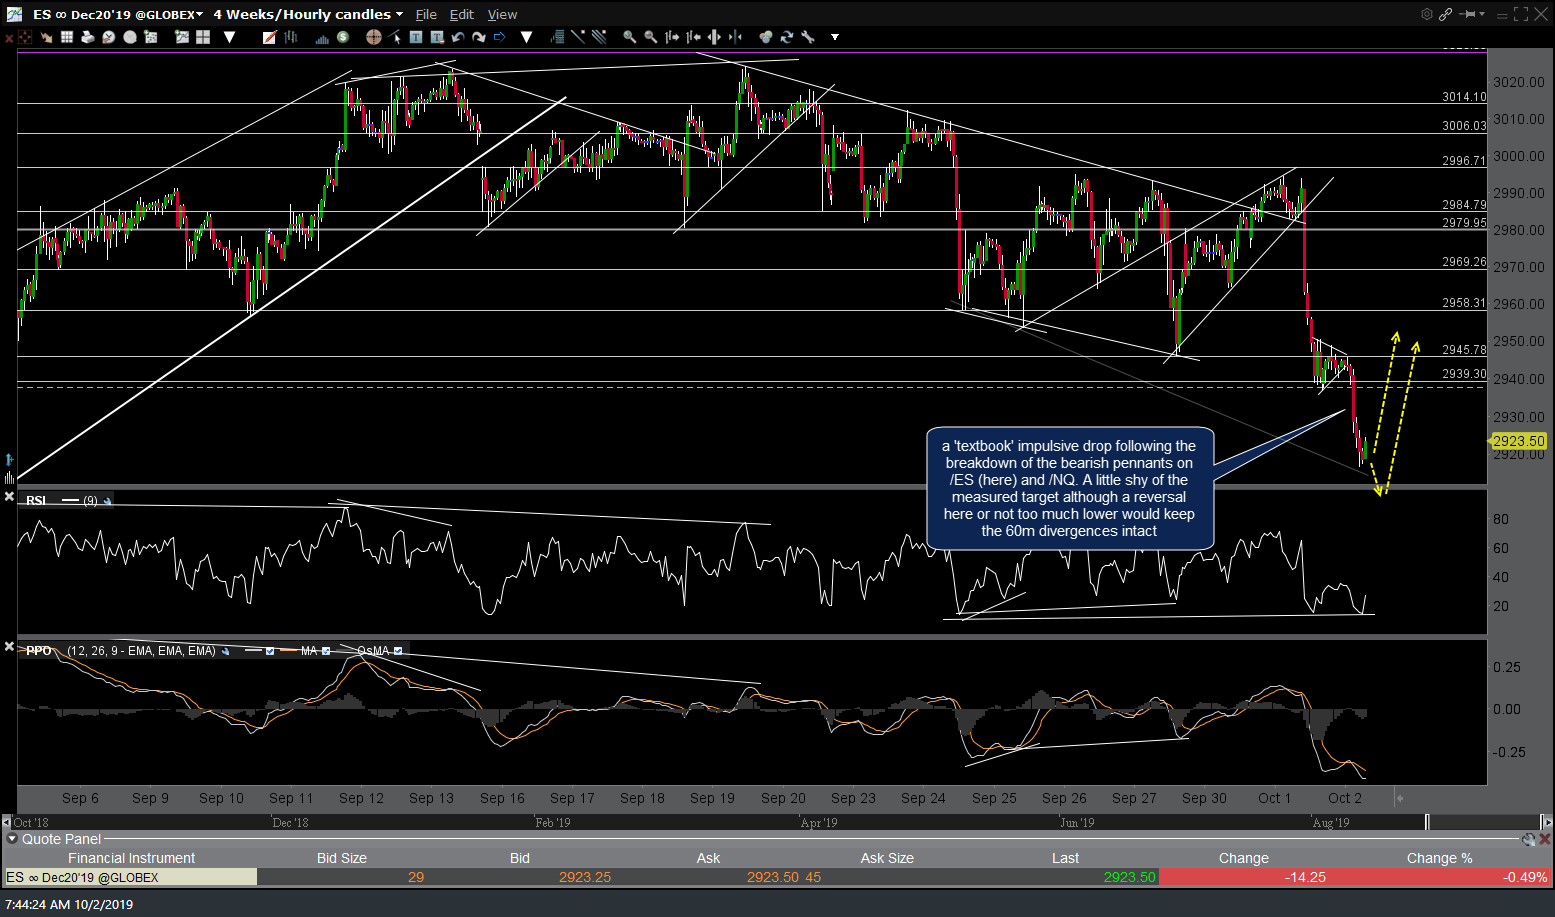
…and here are the updated charts showing the break & impulsive drop below those patterns:
-
- NQ 60m Oct 2nd
-
- ES 60m Oct 2nd
Bearish pennant chart formations are continuation patterns which, just like their very close cousin, the bear flag continuation pattern, consists of 3 parts:
- The ‘flagpole’, which is an impulsive, mostly unidirectional drop (i.e.- nearly straight down with very few, if any, counter-trend kickback rallies)
- The ‘pennant’, which as the name implies, takes the shape of a pennant. This is a consolidation period that follows the preceding sharp drop & allows to the very near-term oversold conditions to alleviate somewhat, typically on lower volume that the move down during the flagpole.
- A sell signal is triggered on a breakdown below the pennant with the subsequent move typically being roughly as impulsive as the move down leading up to the formation of the pennant with the measured target (a rough projection) for the pattern being the distance of the flagpole added to the last point where prices touched the top of the pennant.
As with all chart pattern projections, some fall shy, some play out nearly perfectly & some moves exceed their measured target. In this case, if the indexes can reverse here or soon after just a marginal new low, should we get one more jog down before or shortly after the market opens today, it will keep those positive divergences that were in place heading into the close yesterday thereby setting the stage for a potential snapback rally today. This second /NQ 60-minute chart below shows the 7603ish support level on /NQ that is likely to come into play should we get one more marginal thrust down & that would also align closer to the full projection of the measured target (which again, doesn’t have to be hit).
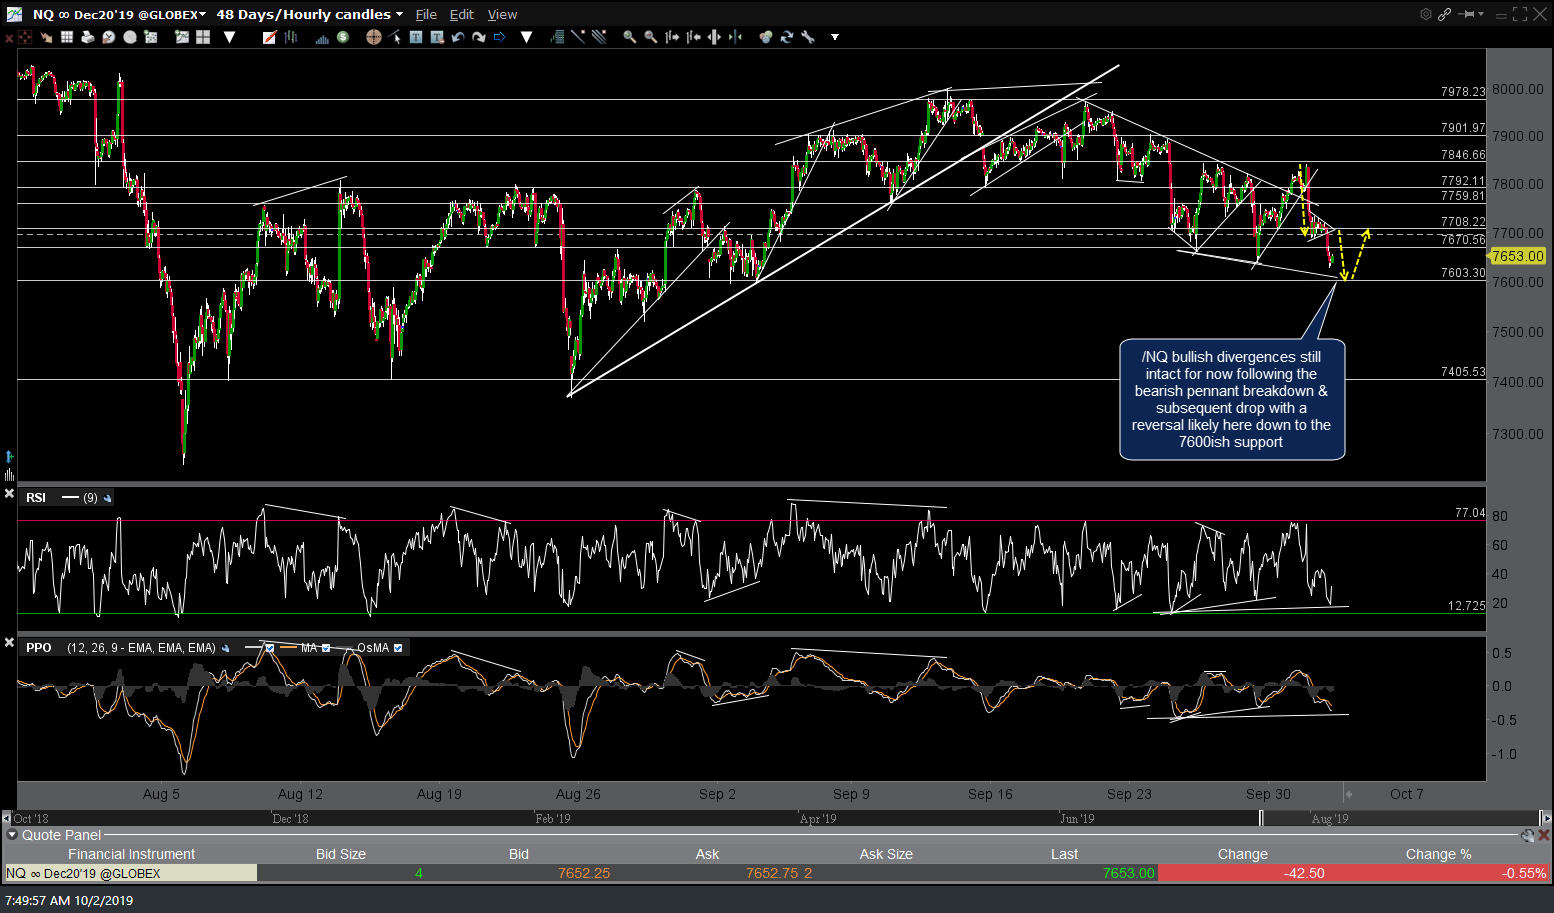
NQ 60m 2 Oct 2nd
Should the indexes fail to reverse soon & rally during the regular session today, that would be quite bearish as the 60-minute divergences will likely be negated (taken out) and more importantly, that could lead to impulsive breakdowns below the key stocks, sectors & indexes on the more significant daily charts. Also worth noting is the fact that the two main risk-off assets, gold & US Treasury Bonds, are still trading just below those key resistance levels that they ran into yesterday; /GC 1492 & /ZB 163’070, with pullbacks in both still likely from here if the equity markets can rally from or just below current levels. Stay nimble or stand aside if not sure what to do & congrats to those that were able to capitalize on these bearish pennant breakdowns.