
/NQ (Nasdaq 100 futures) & /ES (S&P 500 futures) have just hit their first price targets (T1) on the daily charts, where the odds for a reaction are elevated. Arrows show potential bounce targets, SHOULD the indexes bounce off these support levels (which I think there is a decent, but not very high, chance of). However, the risk of a crash-type impulsive drop that slices through some of the early support levels/targets remains elevated, due to the recent major sell signals on the breakdowns below the multi-month trading ranges & 200-day MA’s on both the Nasdaq 100 and S&P 500. Previous & updated daily charts of /NQ below, followed by the updated daily chart of /ES (previous /ES daily charts can be viewed by clicking on the /ES ticker tag at the bottom of this post to reference the previous posts with the /ES daily charts)..
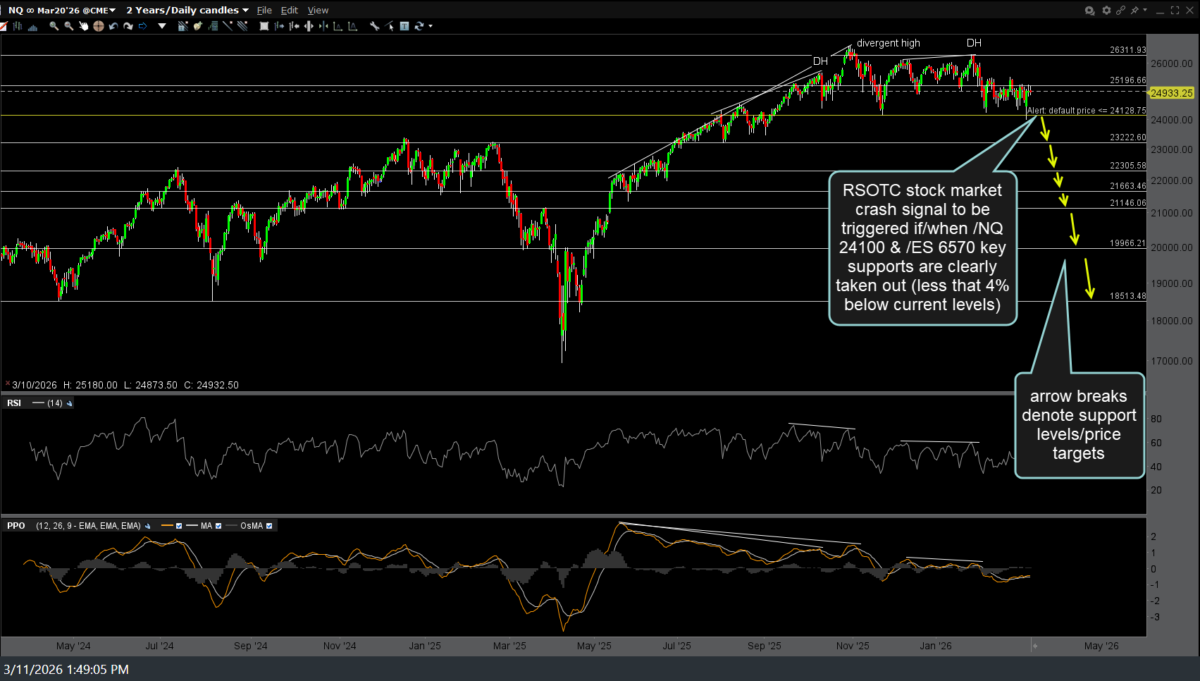
NQ daily March 11th
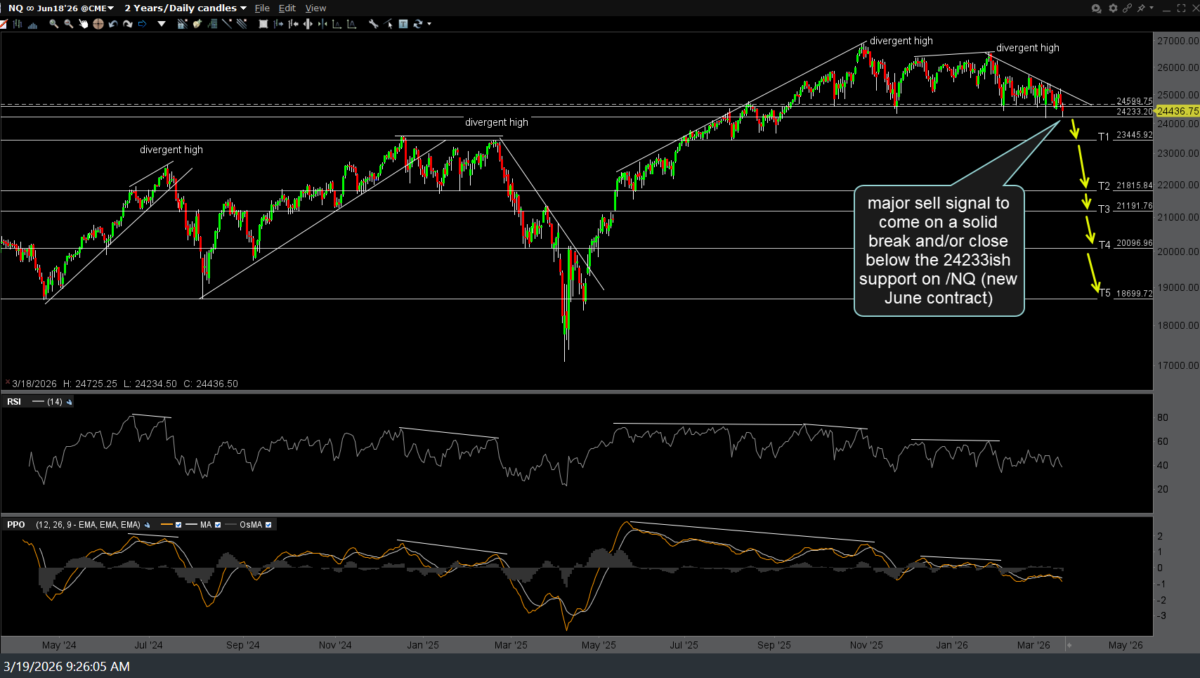
NQ daily March 19th
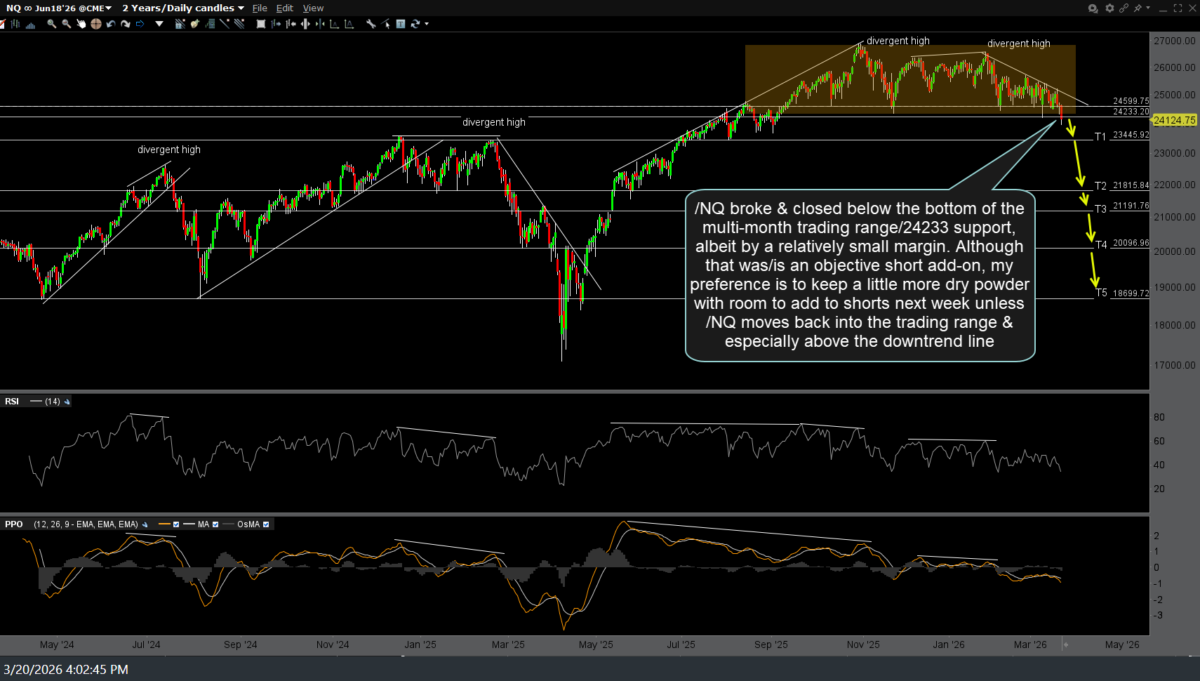
NQ daily March 20th
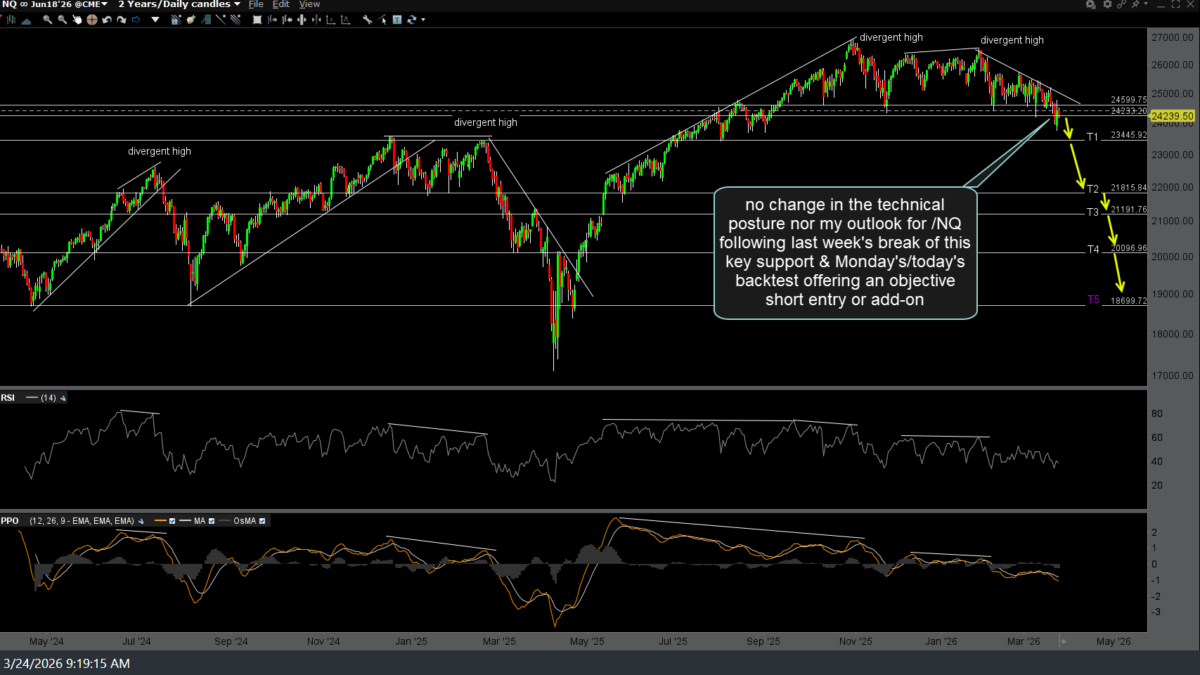
NQ daily March 24th
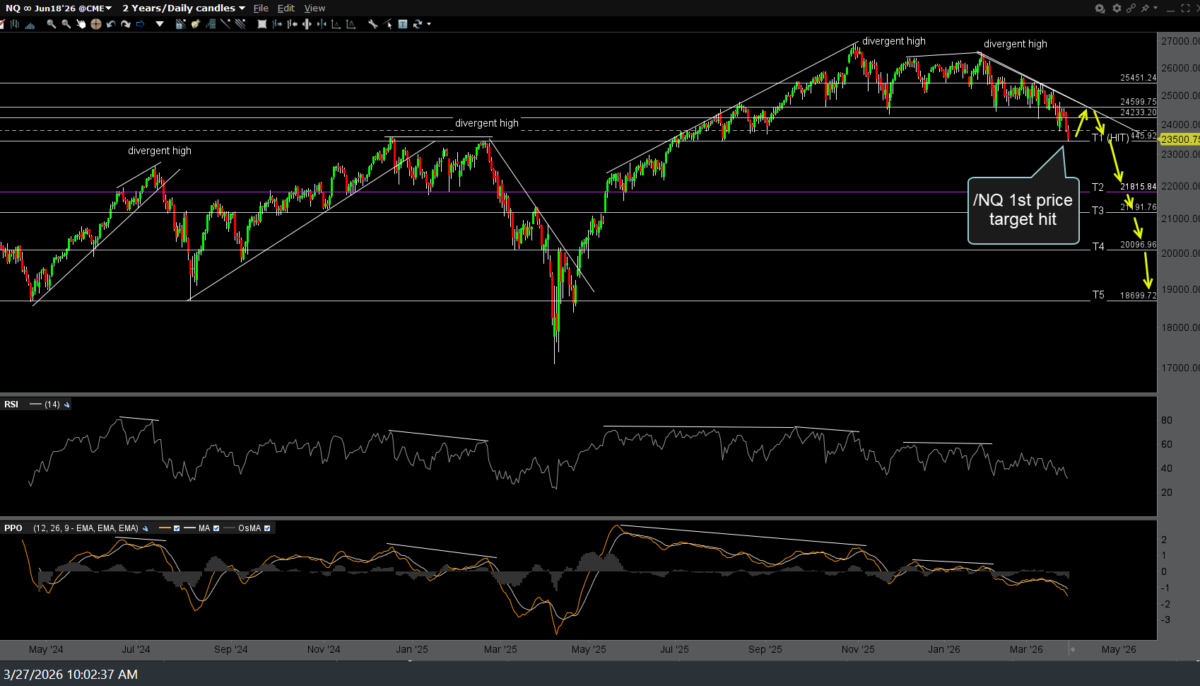
NQ daily March 27th
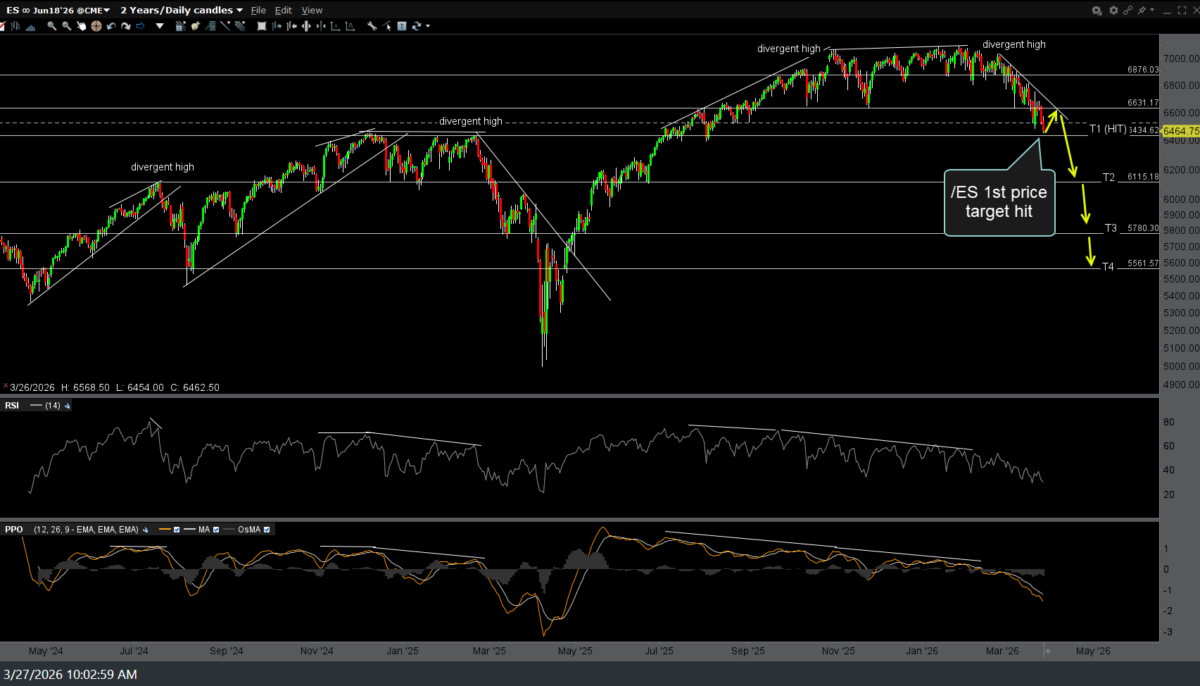
ES daily March 27th
Active traders looking to game a bounce could reverse here (cover shorts & go long) with a stop somewhat below, to allow for the potential of a brief stop raid, while less-active swing & trend traders holding out for any or all of the lower targets might opt to lower stops to protect profits at this time and/or book partial profits with the intent of adding back either on a bounce (ideally just shy of resistance) or if/when these support levels are clearly taken out.