
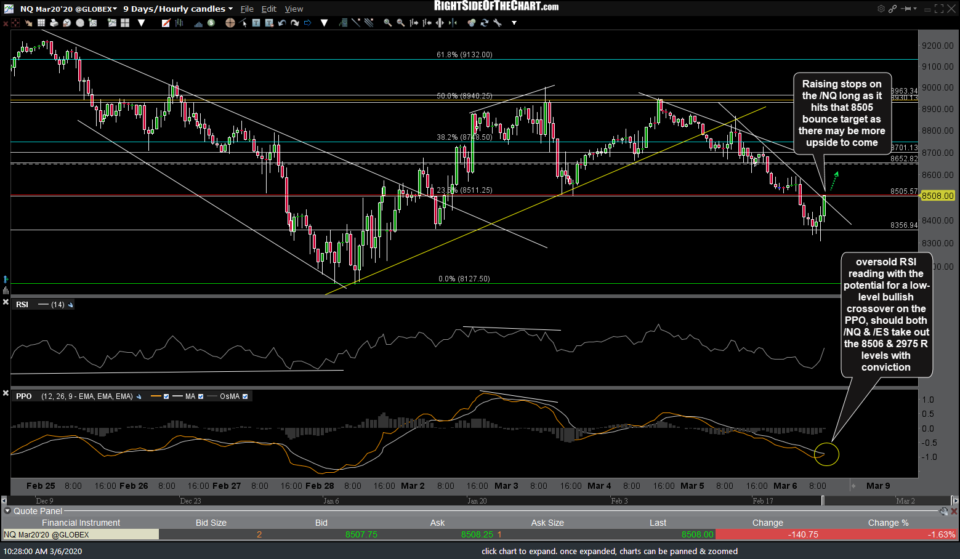
/NQ & /ES have hit those 8506 & 2975 potential bounce targets highlighted earlier today. One of the things that I see which indicates the potential for a rally beyond those resistance levels is the technical posture of the risk-off assets (gold & Treasuries) that I posted earlier as well as the $VIX. Previous & updated /NQ 60-minute charts below.
-
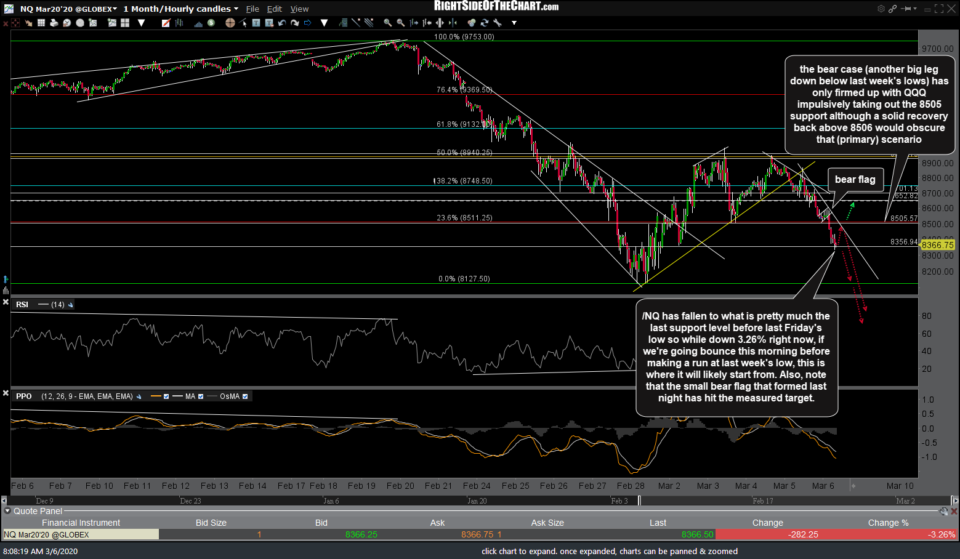
- NQ 60m March 6th
-
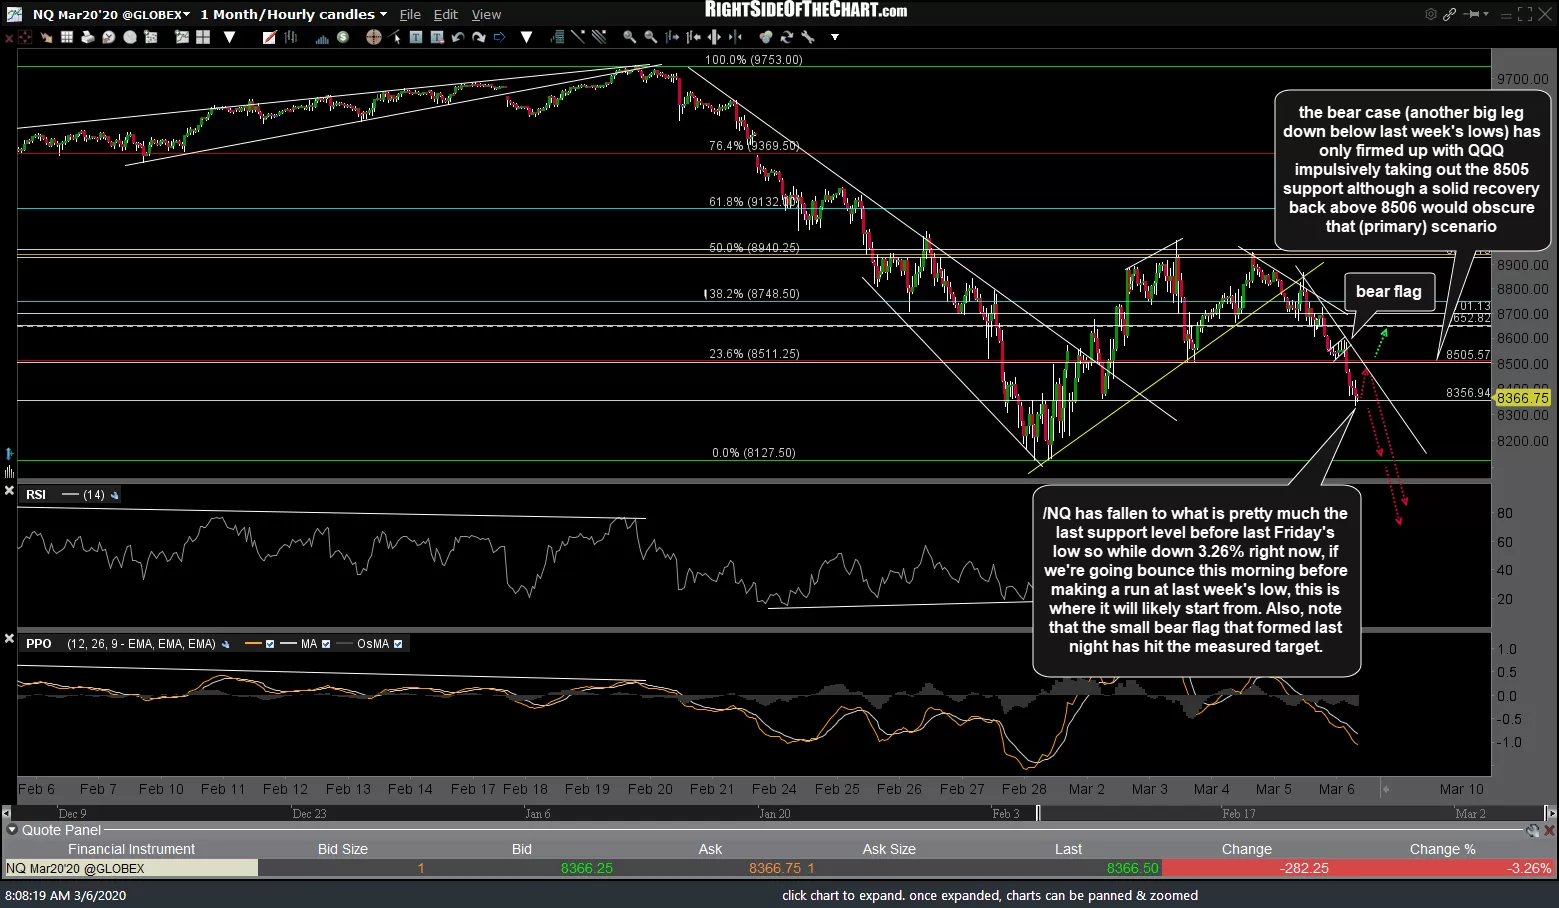
- NQ 60m 2 March 6th

The $VIX (CBOE Market Volatility Index) has hit the top of its multi-year trading range… a significant resistance level that has previously been followed by rallies in the stock market following corrections.
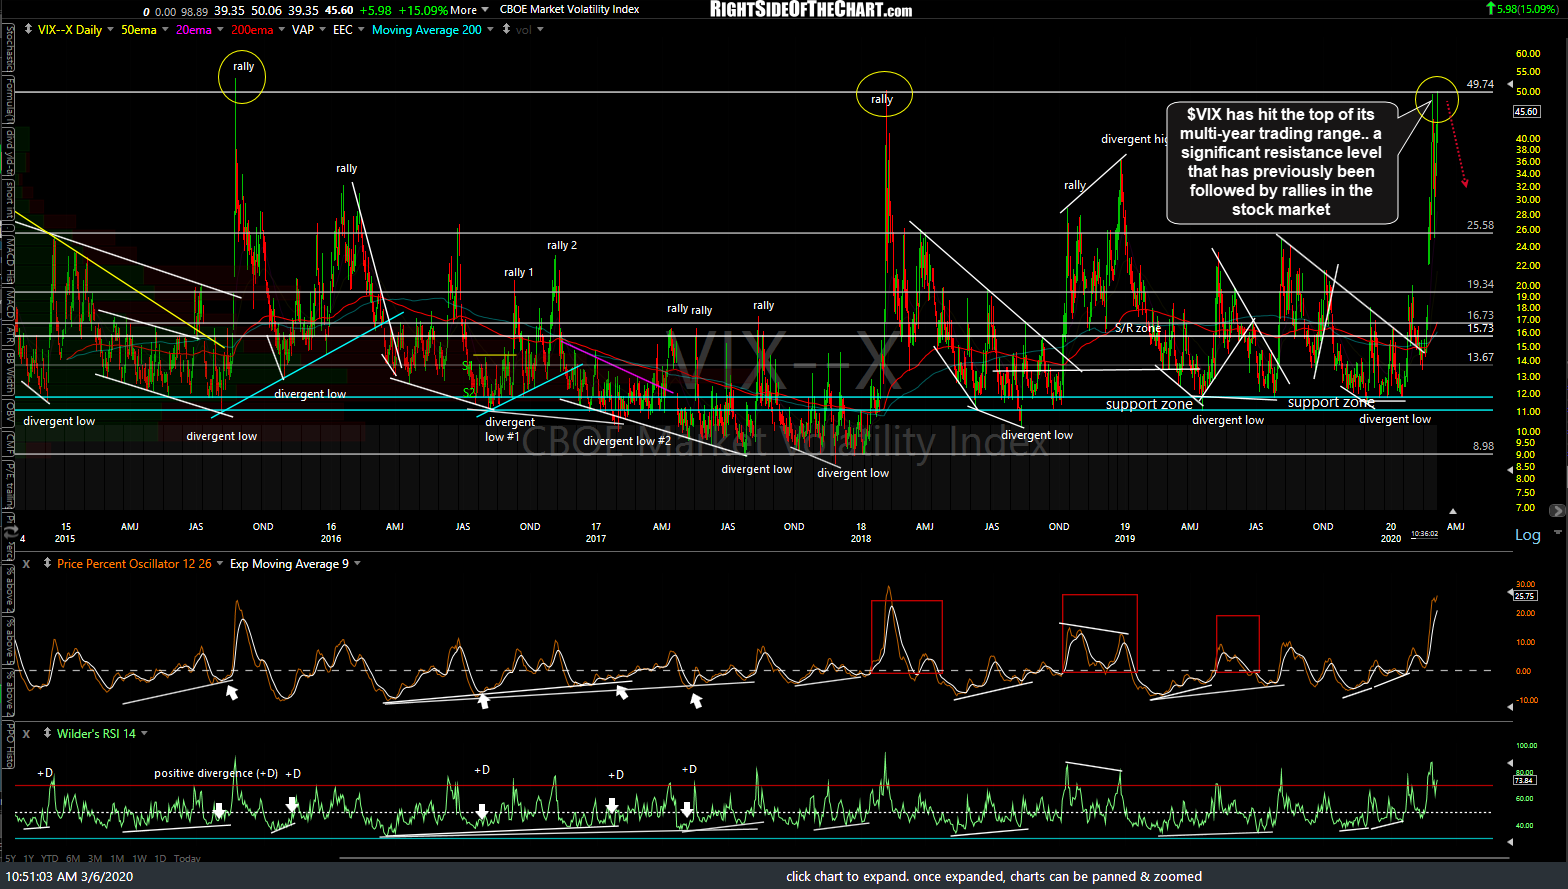
$VIX daily March 6th
As I type, /NQ has is trading right on that 8506 resistance with /ES just kissing its comparable 2975 resistance level & pulling back slightly since (with at least a slightly deeper pullback likely as these are solid resistance levels). Anyone’s game here (bulls or bears) so stay flexible if actively trading & for less active swing traders, as I like to say; Resistance is resistance until & unless taken out as of now, we simply have a typical bounce off support back into resistance on the indexes where the bounce could end, followed by another major leg down.
Should that happen (more than just a relatively minor pullback off these resistance levels, which is very likely on this initial tag), this morning’s lows are still support & even more so than earlier today when I first highlighted them as we’ve since had a clear reaction (bounce) off those levels. As such, a solid break below today’s lows would likely open the door to the next wave of selling while a solid break above today’s (so far) highs of 208.51 in QQQ & 297.97 in SPY (and the comparable HOD‘s in the futures) could spark another leg higher.

SVXY daily March 6th
For those interested, a very aggressive trade with above-average gain potential, should the stock market continue to build on the post-opening recovery rally, is SVXY, the ProShares Short VIX Short-term Futures ETF, which would benefit from a drop in the $VIX. Keep in mind that the market could easily take another leg down but from a R/R perspective, I do not think a long on the $VIX (TVIX, VXX, etc..) is very objective here as although the $VIX can certainly move well beyond this resistance level, it tends to drop like a rock once the market starts to rally, especially when it is trading at or near the top of its range.
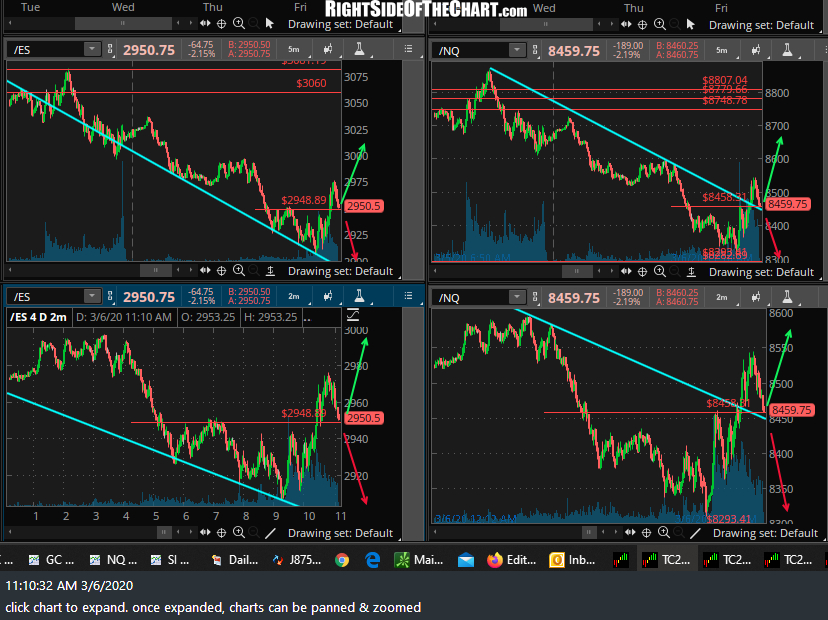
ES NQ mosaic March 6th
Finally, as I continue to compose this post, /NQ & /ES have pulled back, as expected, off the initial tag of the aforementioned resistance levels to minor support levels which “should” contain the pullback, assuming the indexes will go on to break above those resistance levels that have so far checked this morning’s partial recovery rally. “Should” contain the pullback simply means this is where I think the pullback off the initial tag of those bounce targets will end, IF the market is going to power back up & make another run at or beyond those levels. (Translation: This offers an objective, but aggressive long entry for active traders with a stop somewhat below as well as a potential pullback target for those that shorted the initial pop into those resistance levels). The /ES 5-minute & 2-minute charts are on the left with the /NQ 5 & 2-minute charts on the right.