
The recently highlighted bullish divergences on the 60-minute charts of /ES (S&P 500) and /NQ (Nasdaq 100) ended up playing out for a tradable bounce, with the final thrust coming just after yesterday’s video when /NQ followed the breakout in /ES above those highlighted resistance levels (/ES has broken out after the video started & /NQ was highlighted testing the comparable resistance at the end of the video).
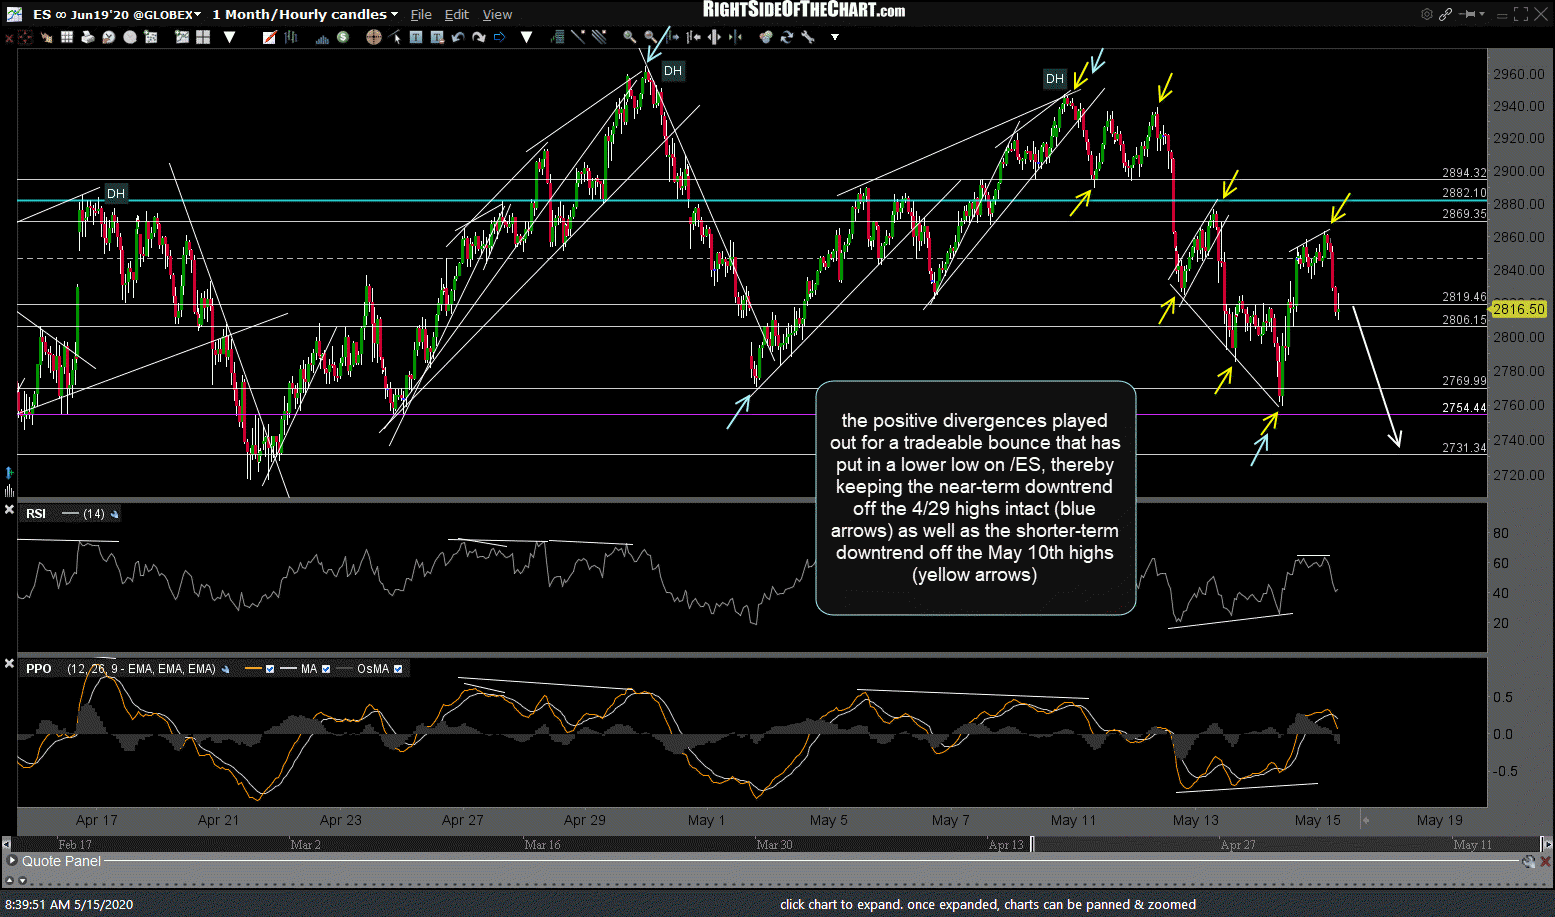
ES 60m May 15th
Those dual breakouts in /ES & /NQ were the catalysts for the final thrust up late yesterday which carried /NQ up to that 9111.50ish resistance level, which capped the rally & put in a lower low in the indexes, keeping the near-term downtrend well intact for now. A downtrend is defined as a security making a series of lower highs & lower lows. At this point, we have a near-term downtrend in /NQ off the May 12th high while the more significant /ES has been in a downtrend since peaking back on April 29th. Both downtrends will be extended should the major stock indexes take out yesterday’s lows which appears likely based on the recent bearish developments on 60-minute charts as well as the longer-term time frames.
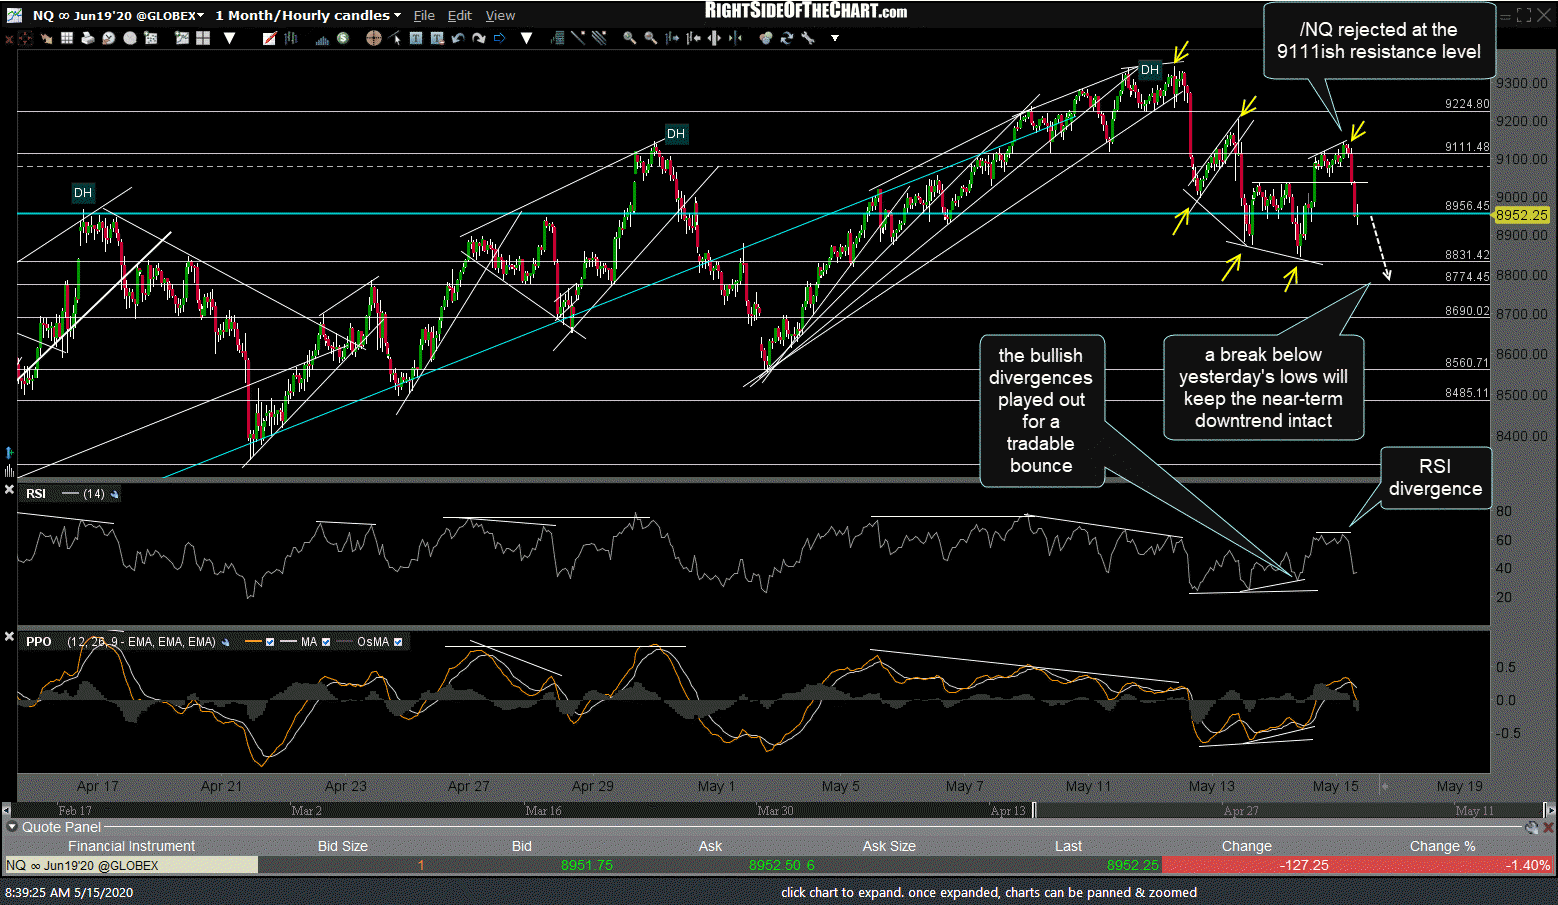
NQ 60m May 15th