
/NG (natural gas futures) has potential positive (bullish) divergences building on the PPO & RSI although it just recently broke below the 2.556 support level & was then rejected off the backtest from below. A recovery of 2.556 next week could trigger the next wave of buying although that level now remains resistance until & unless taken out.
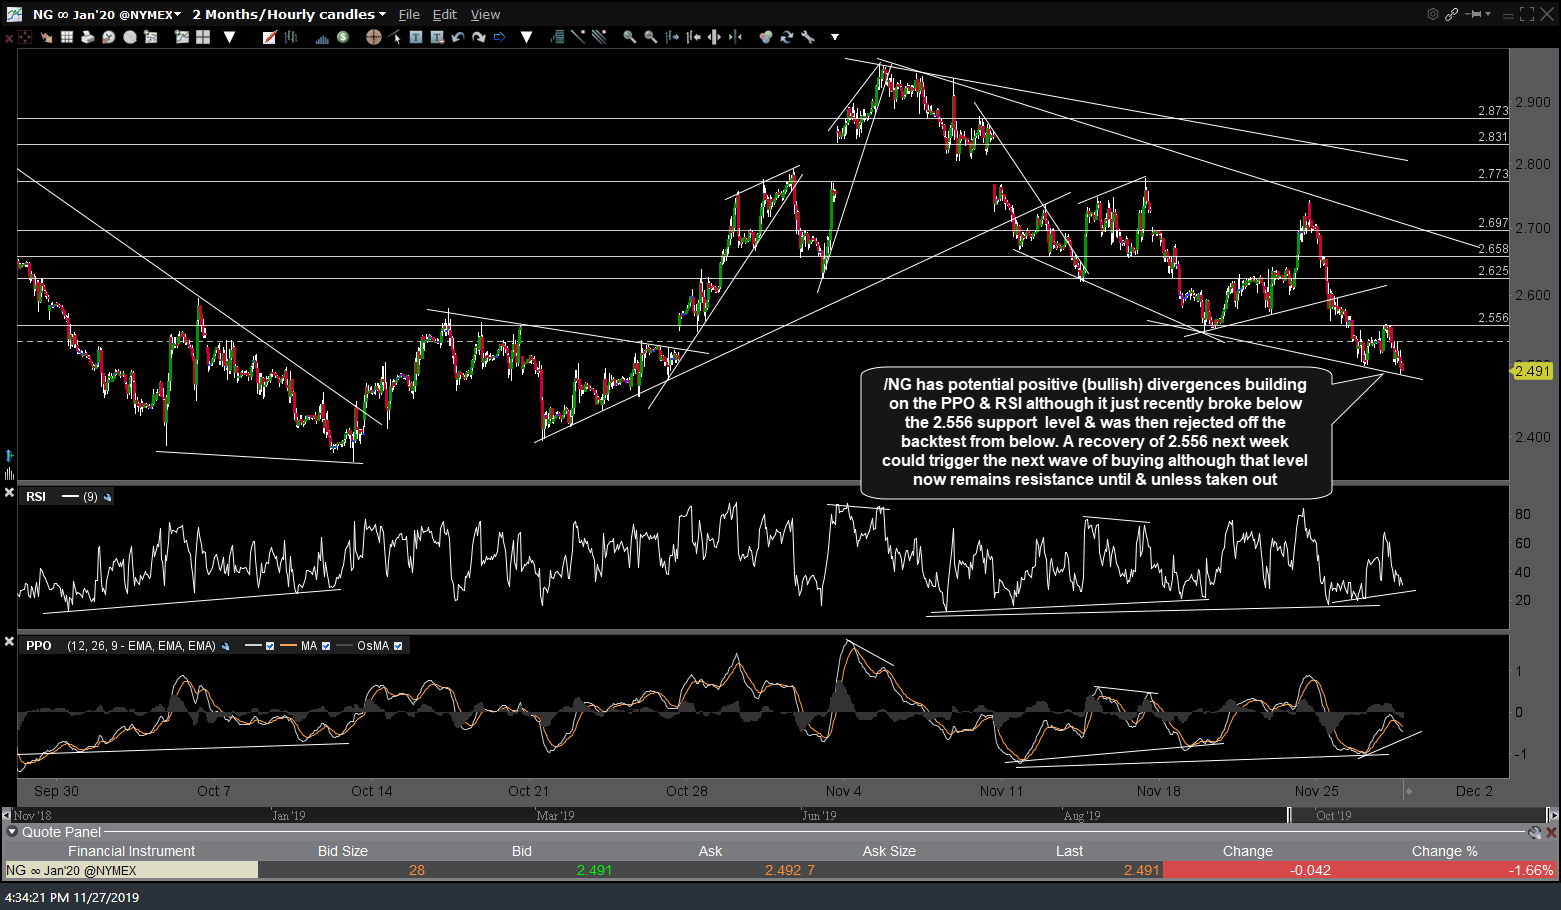
NG 60m Nov 27th
Likewise, UGAZ (3x bullish nat gas ETN) has positive divergence on this 60-minute chart although it just broke & closed the week below the fairly significant 12.45 support (now resistance) level.
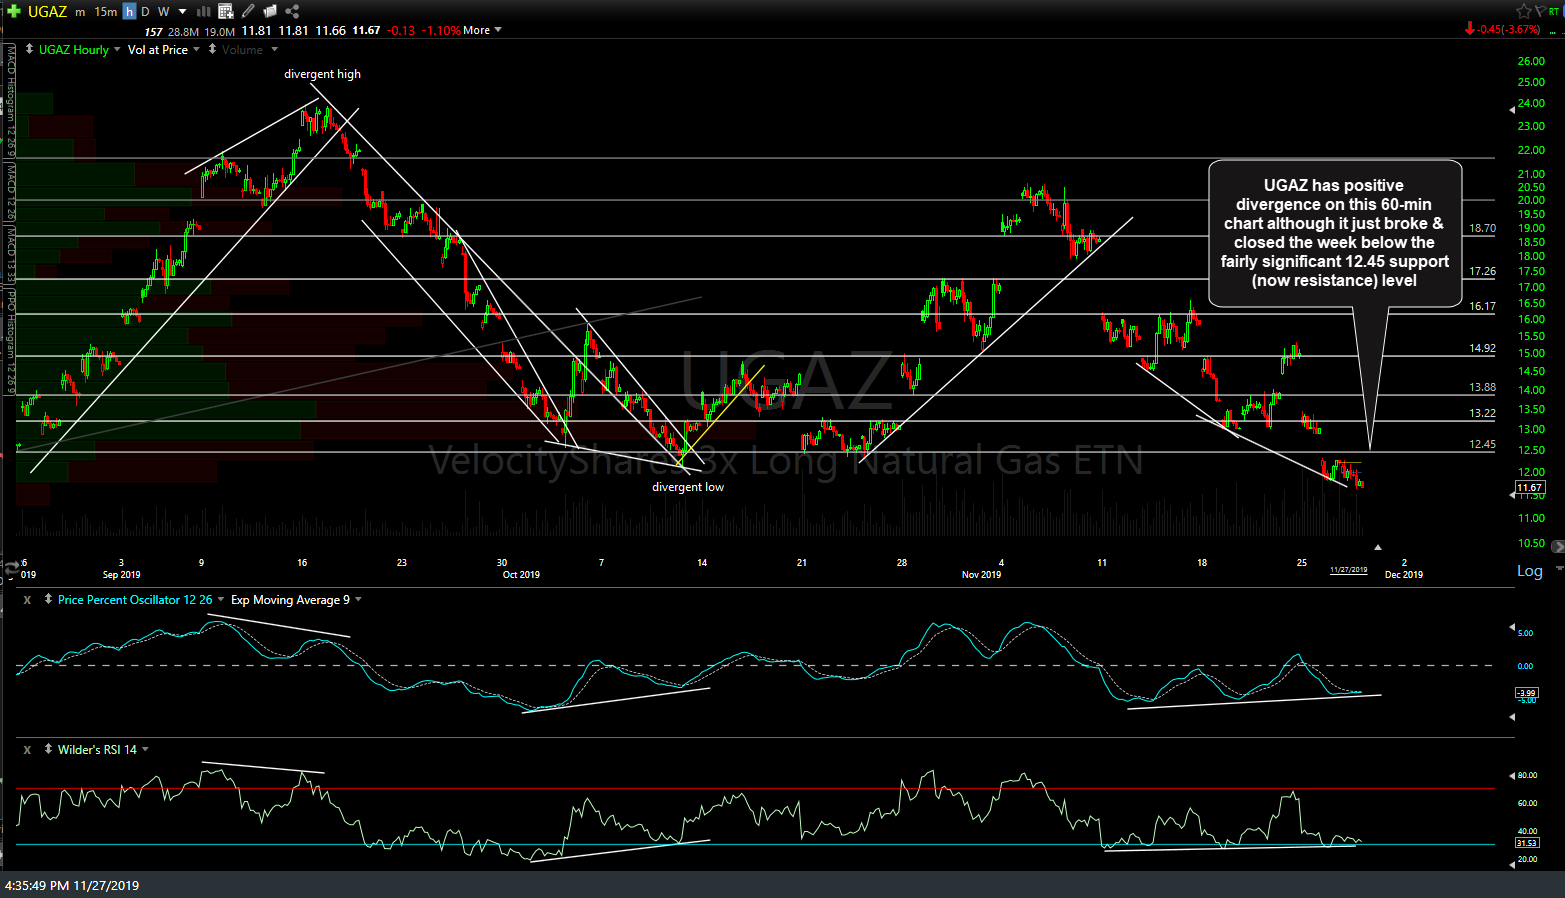
UGAZ 60m Nov 27th
/CL (crude futures) has been trading range-bound between the 58.67 & 57.50 support & resistance levels since Thursday of last week with the most recent high a divergent high. Just as with the closely correlated stock market, the trend since the October 3rd low remains bullish although a solid break below 57.50 would likely bring /CL back down for another test of the uptrend line.
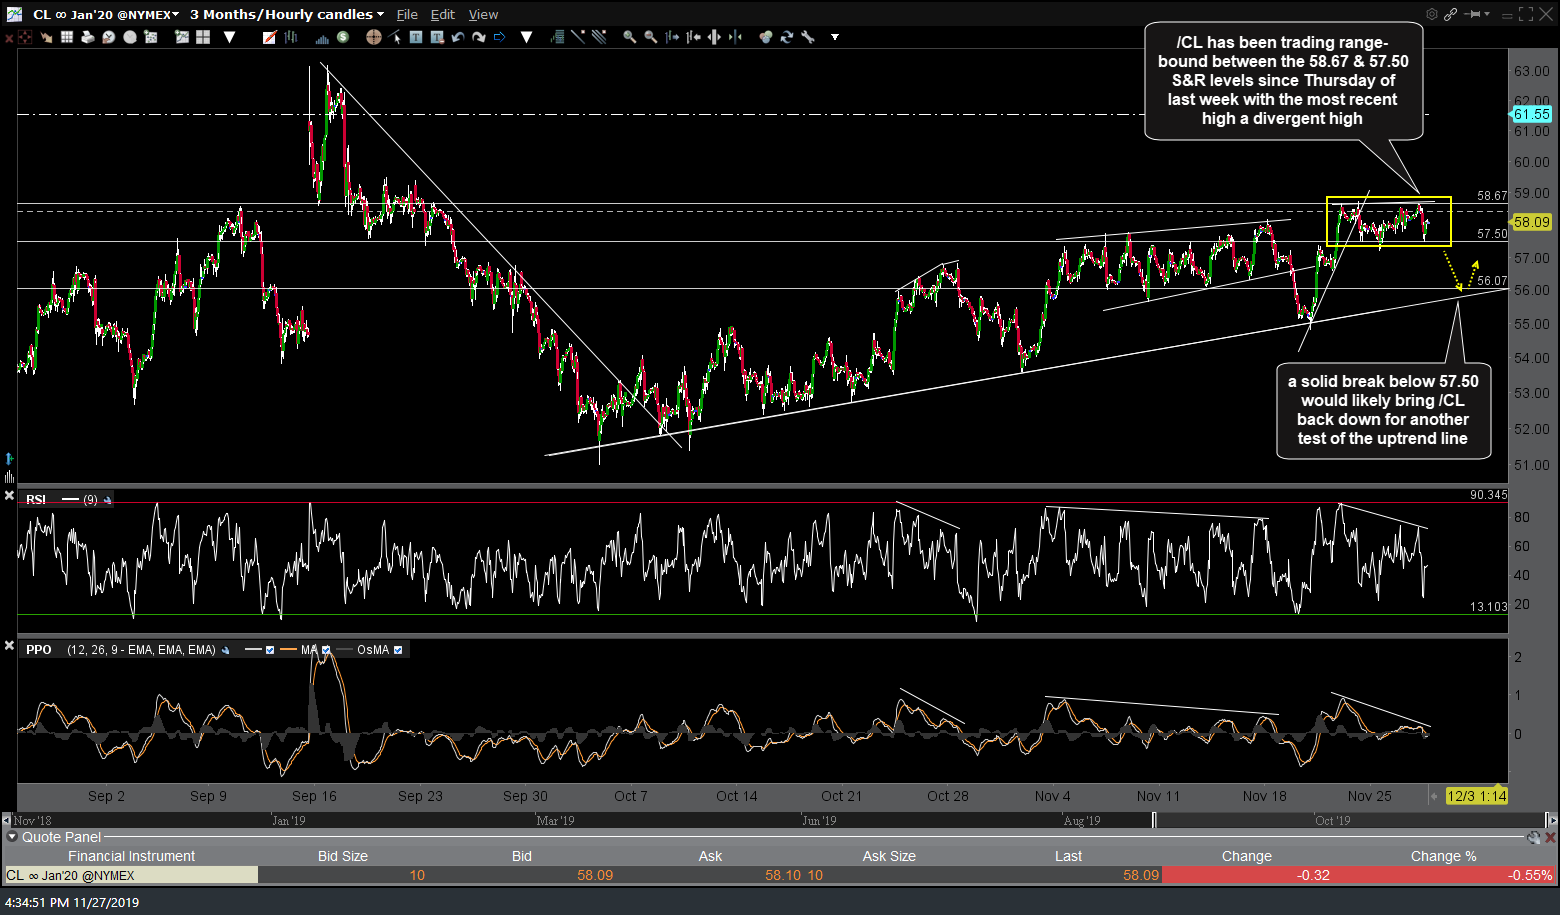
CL 60m Nov 27th
Zooming out to the longer-term daily chart of USO (crude oil ETN), other than this brief period last spring, crude has traded within the trading range (yellow box) throughout most of 2019. USO is trading at the 12.06ish & potential downtrend line resistance level with trendline support somewhat below.

USO daily Nov 27th
Similar to crude futures, USO has been working its way up this 60-minute price channel with negative divergences building on the indicators below. Should the divergences play out for a pullback next week, the lower trendline “should” act as support although a solid break below would likely open the door to additional selling.
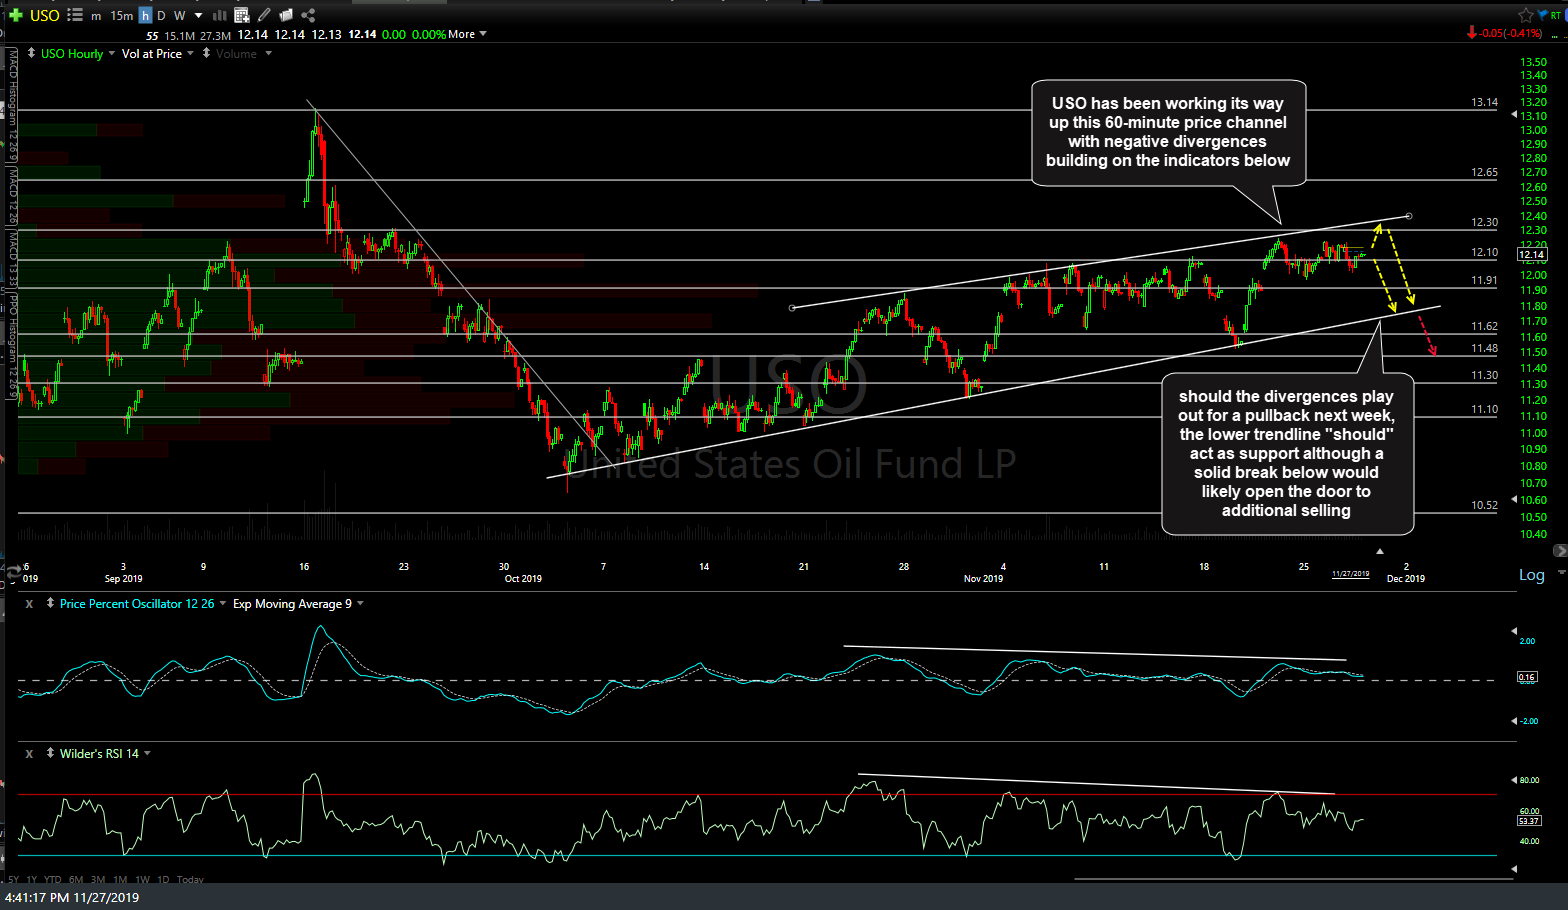
USO 60m Nov 27th