
/NQ reversed right on cue yesterday a the minor downtrend line + price resistance which was highlighted as an objective level to reverse from long back to short. That was good for a quick 2¼% pullback trade with /NQ hitting & bouncing off the 11434ish support, so far. I’d put fair odds on another run at the trendline but either way, a break below the recent lows would open the door to the next leg down towards 14050.
The light-colored arrows show the alternative “near-term bullish/intermediate-term bearish” scenario of a rally up to the primary downtrend line before a resumption of the primary downtrend off the early September highs. However, that still remains my alternative scenario with the odds for my primary scenario (yesterday’s bounce terminated at the minor downtrend line with the next leg down towards QQQ T3 & /NQ 14050 underway) increased since laid out in the late-session video now that most of yesterday’s rally has been faded. 120-minute chart below.
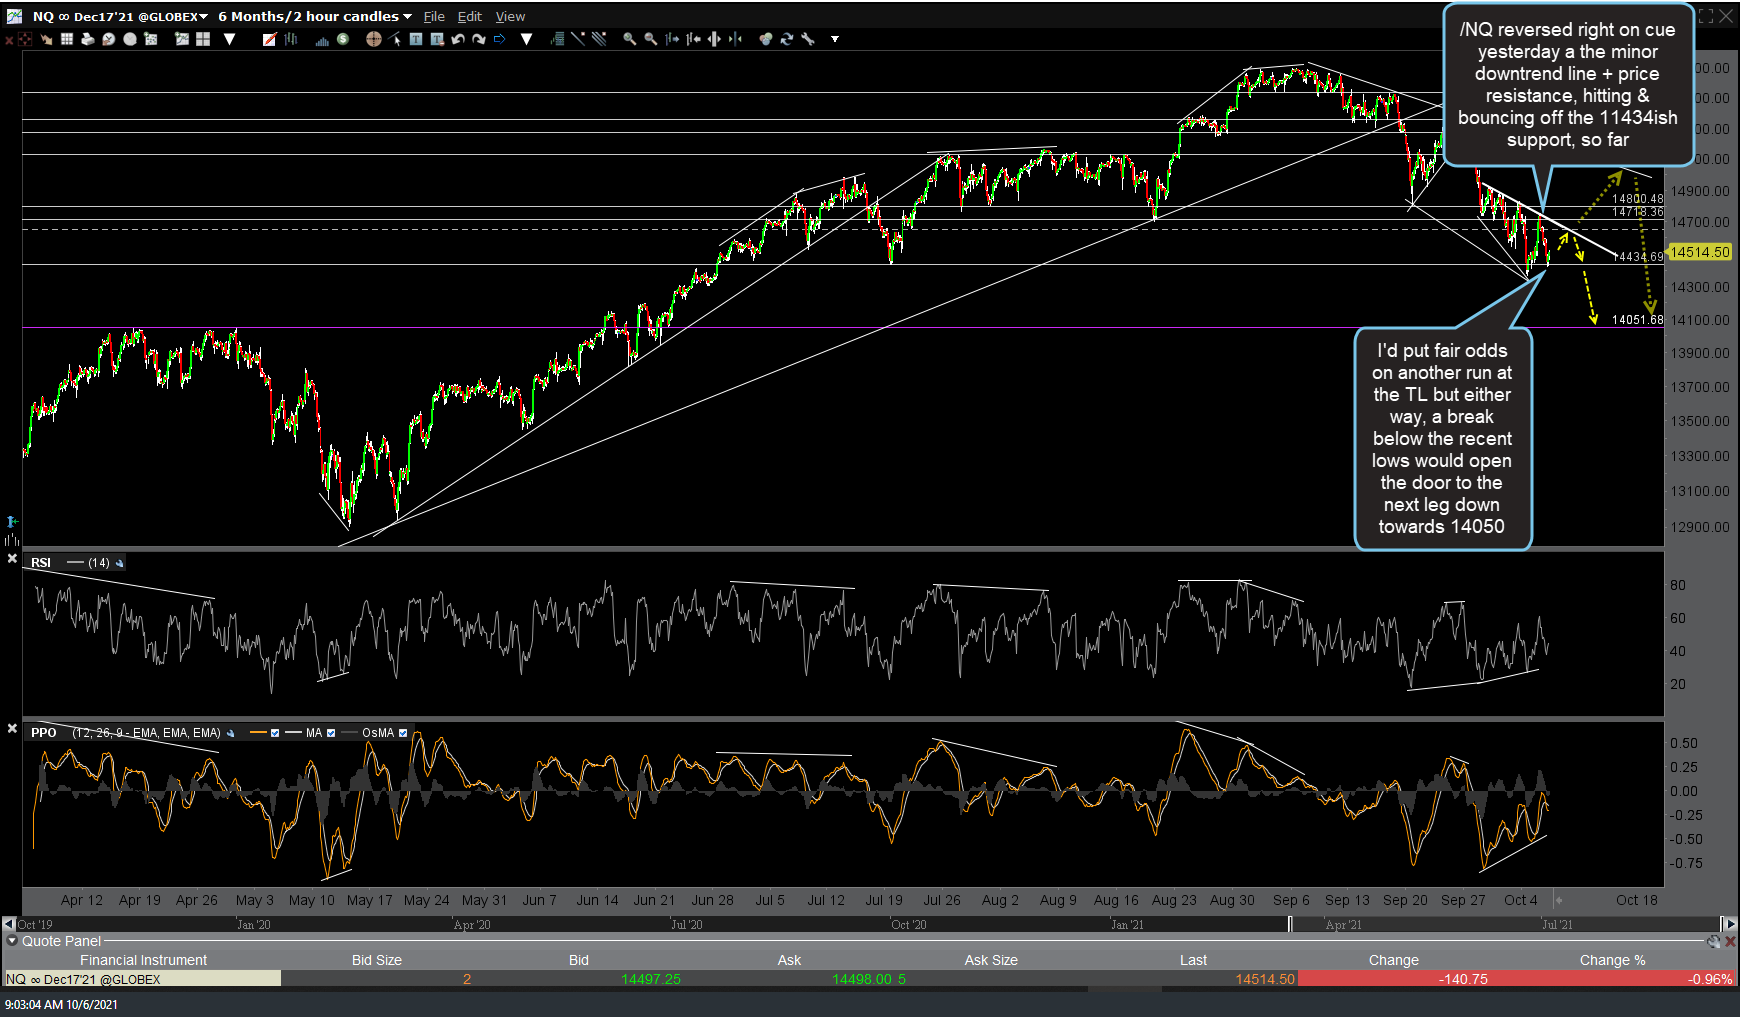
NQ 120m Oct 6th
/NG (natural gas futures) is trading at the bottom of the 60-minute bearish rising wedge pattern with a sell signal still pending a solid break below it. /QG is the symbol for the MINY nat gas futures contract while KOLD is the -2x inverse (short) nat gas ETN.
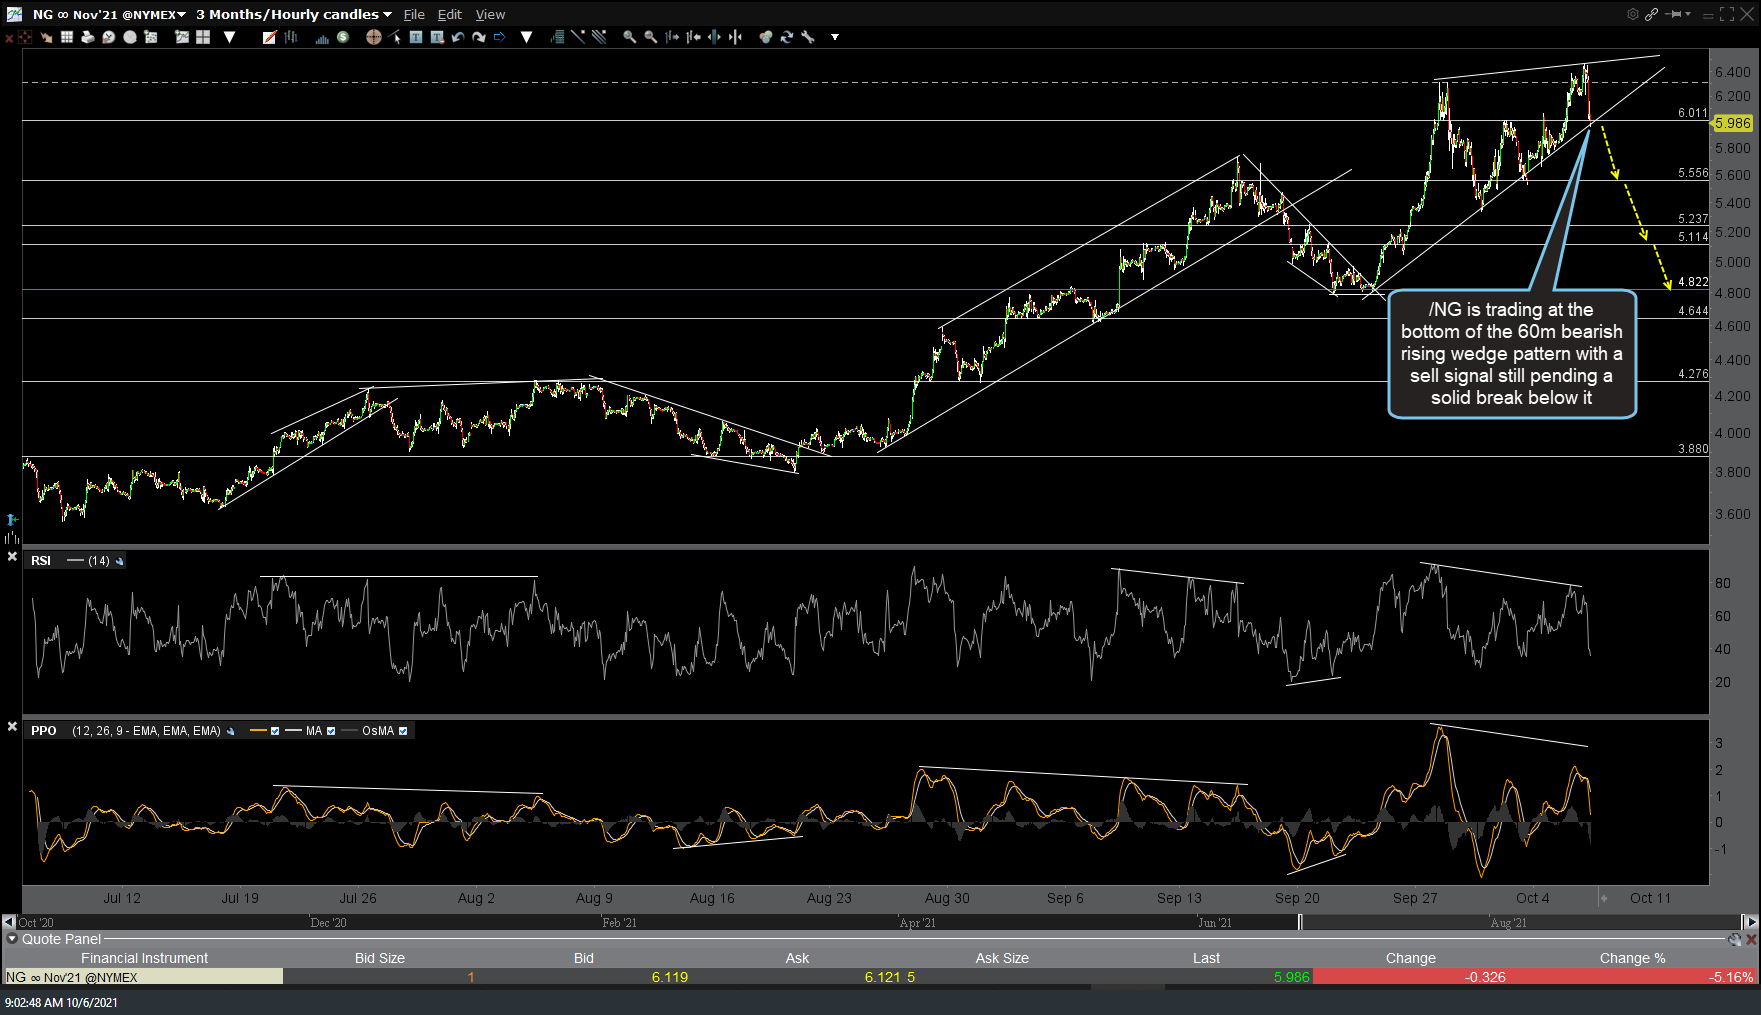
NG 60m Oct 6th
A sell signal on /CL (crude oil futures) is still pending a solid break below this 120-minute uptrend line.
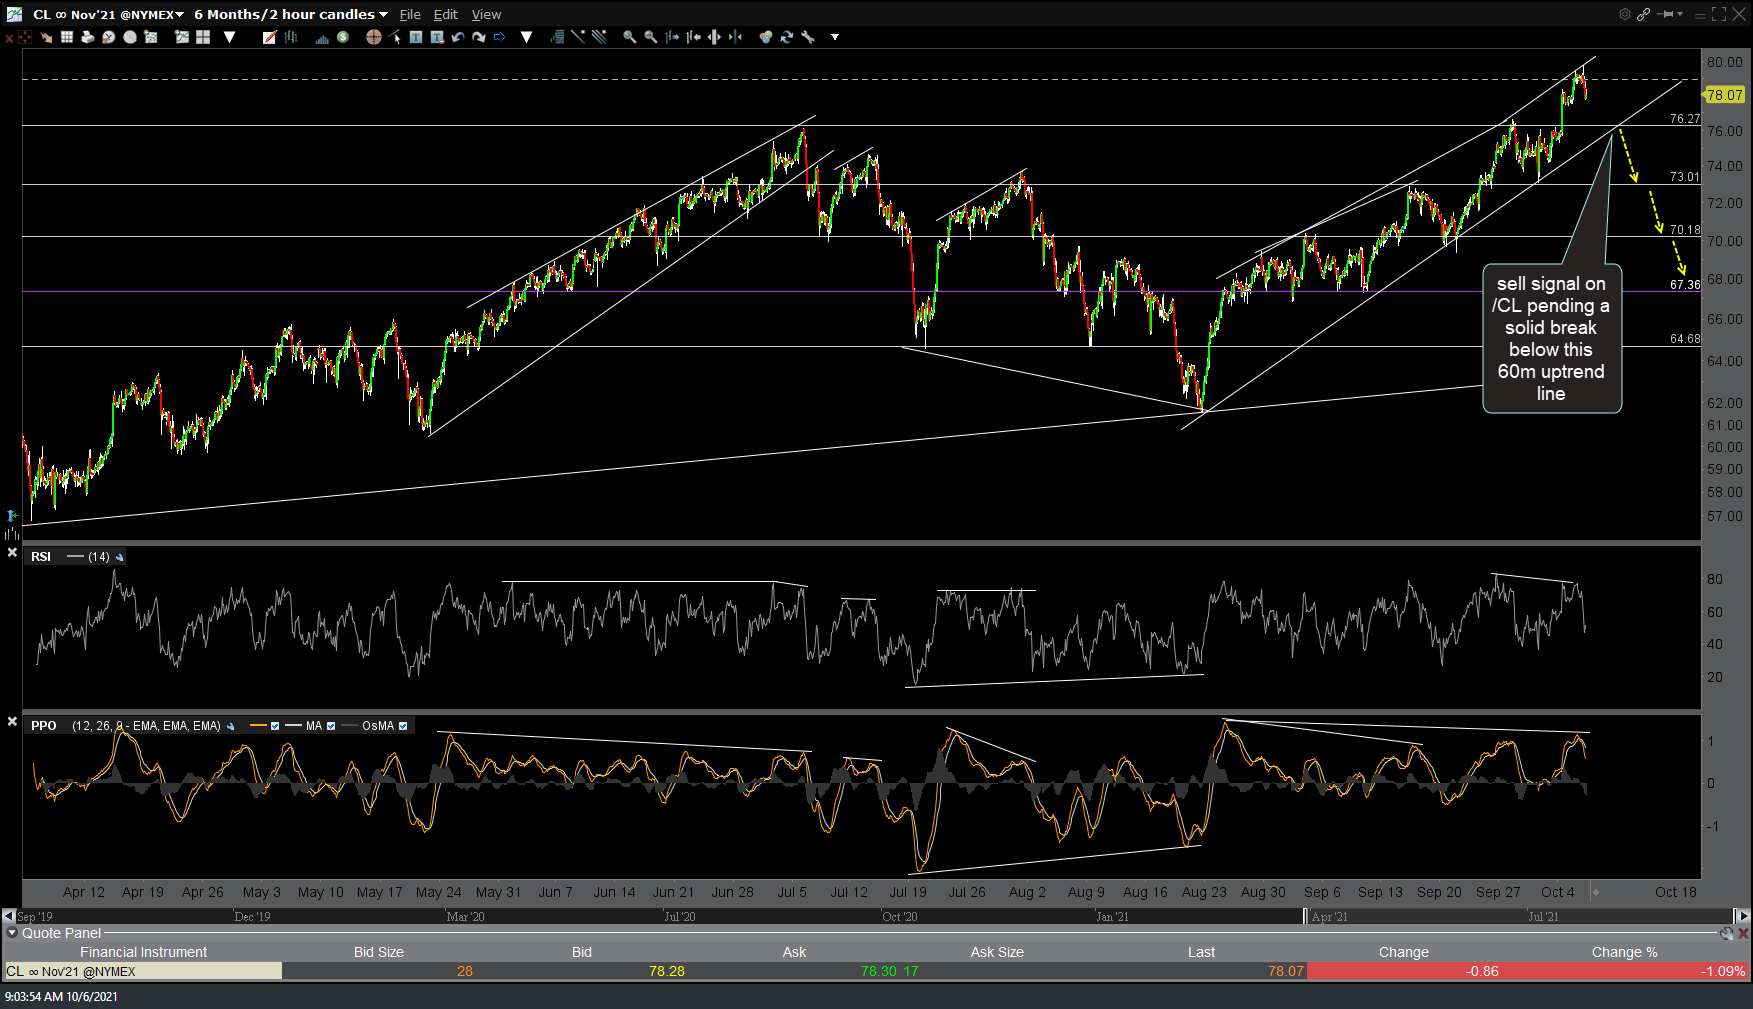
CL 120m Oct 6th