
/NQ still testing the 18046ish key support/ resistance (bottom of trading range) with a solid 60m & especially a solid daily close back above it bullish while an impulsive rejection, especially a drop back below 433 on QQQ would be bearish. 60–minute chart below.
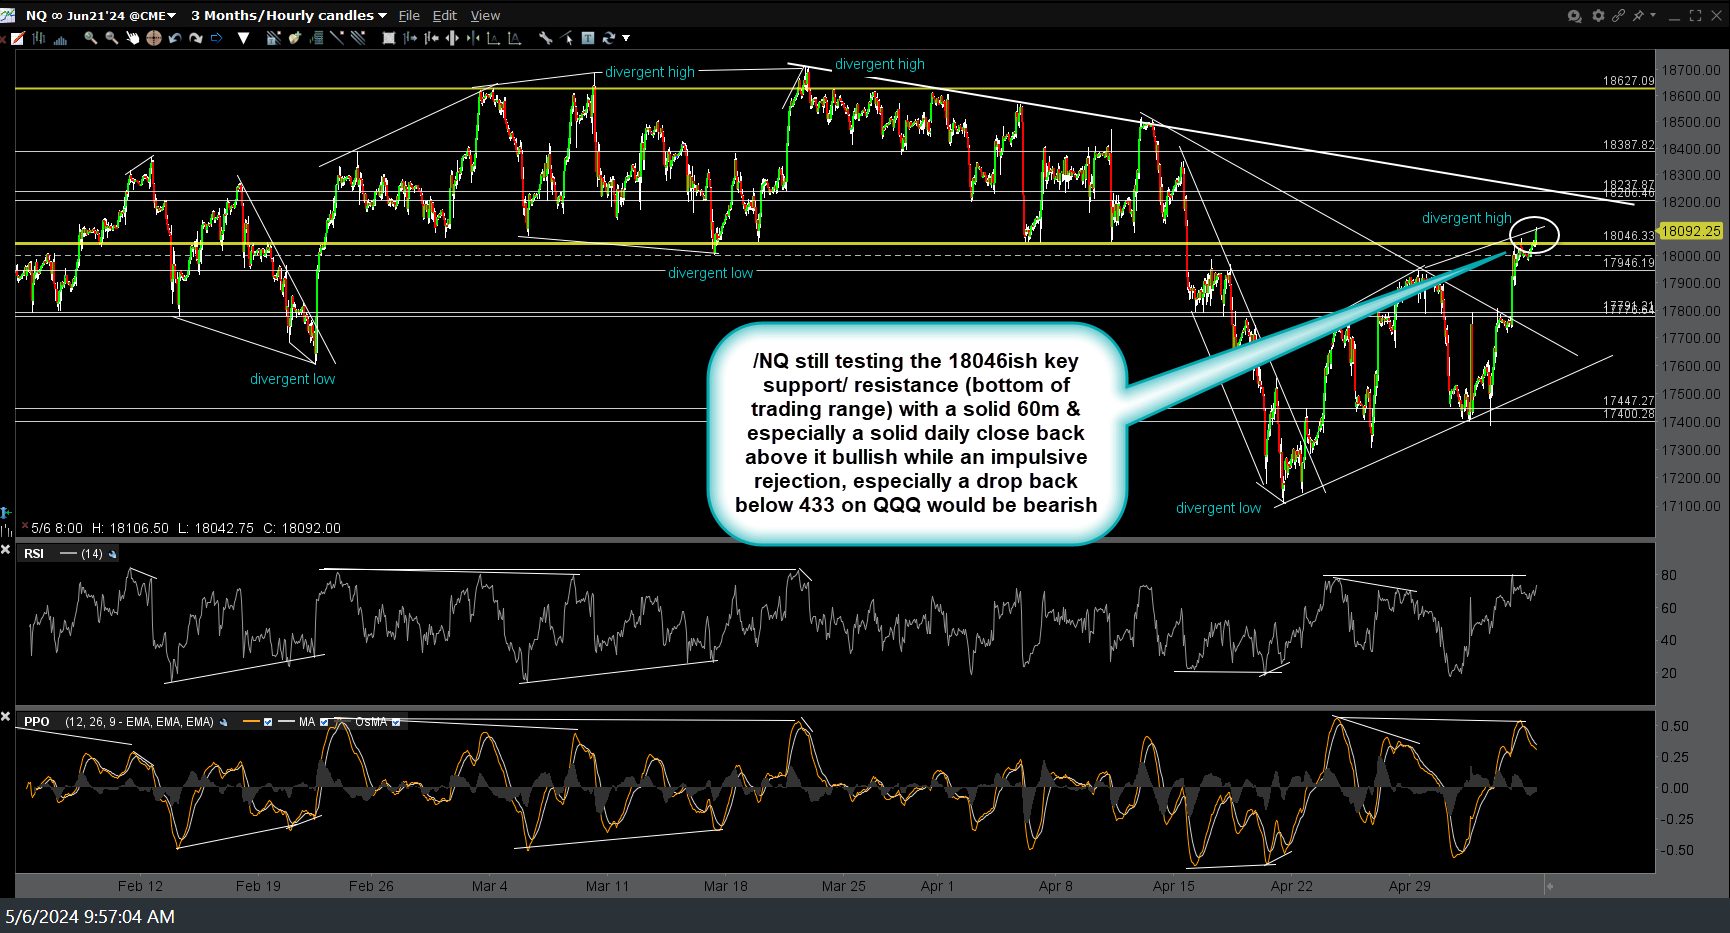
NQ 60m May 6th
The daily charts below are the largest components of the Nasdaq 100 in order by market-cap (and weighting) with some of the more significant nearby support/resistance levels as well as potential key developments to watch for.
MSFT backtesting the recently broken 50-day EMA from below (again) following the brief pre-earnings whipsaw dip below my key 397 yellow support & bottom of purple trading range.

MSFT daily May 6th
AAPL post-earnings pop capped at the 186.65 R & faded a bit today to bring it back in close proximity to the 200-day SMA & the key 180 support level.
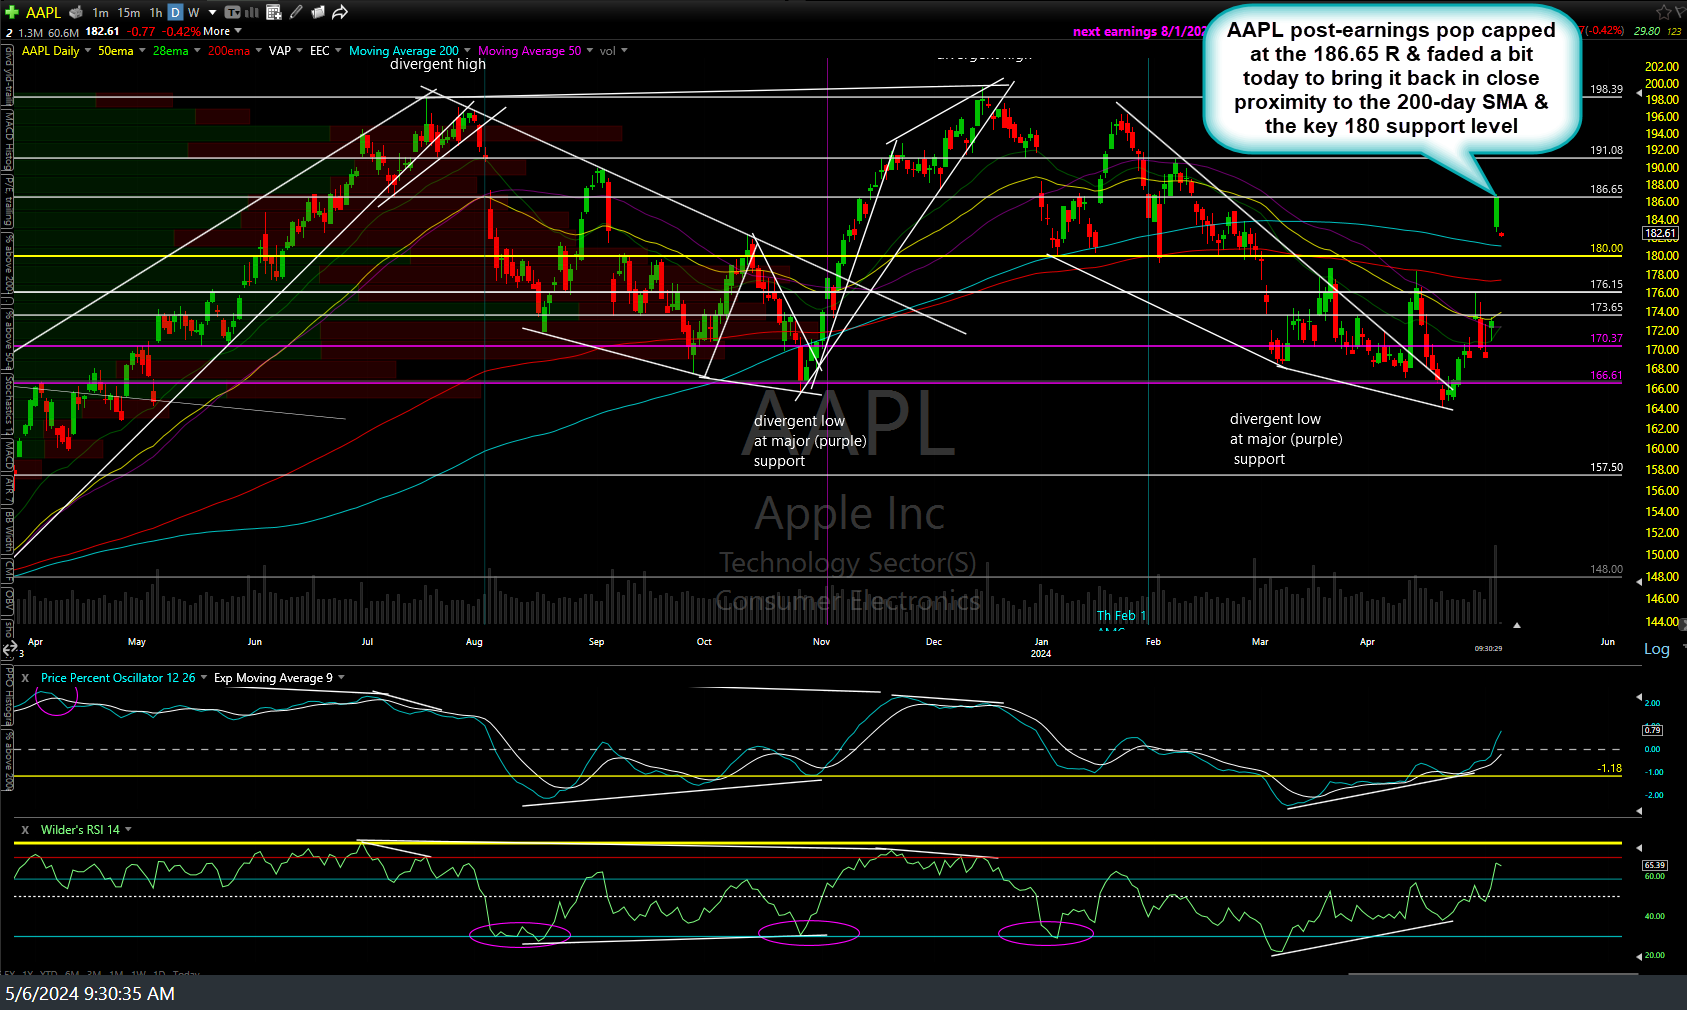
AAPL daily May 6th
NVDA very whippy during the recent peak-earnings week, currently back at the mid-point of the purple trading range & still comfortably above my key 742 yellow support & intersecting primary uptrend line with earnings coming up soon.
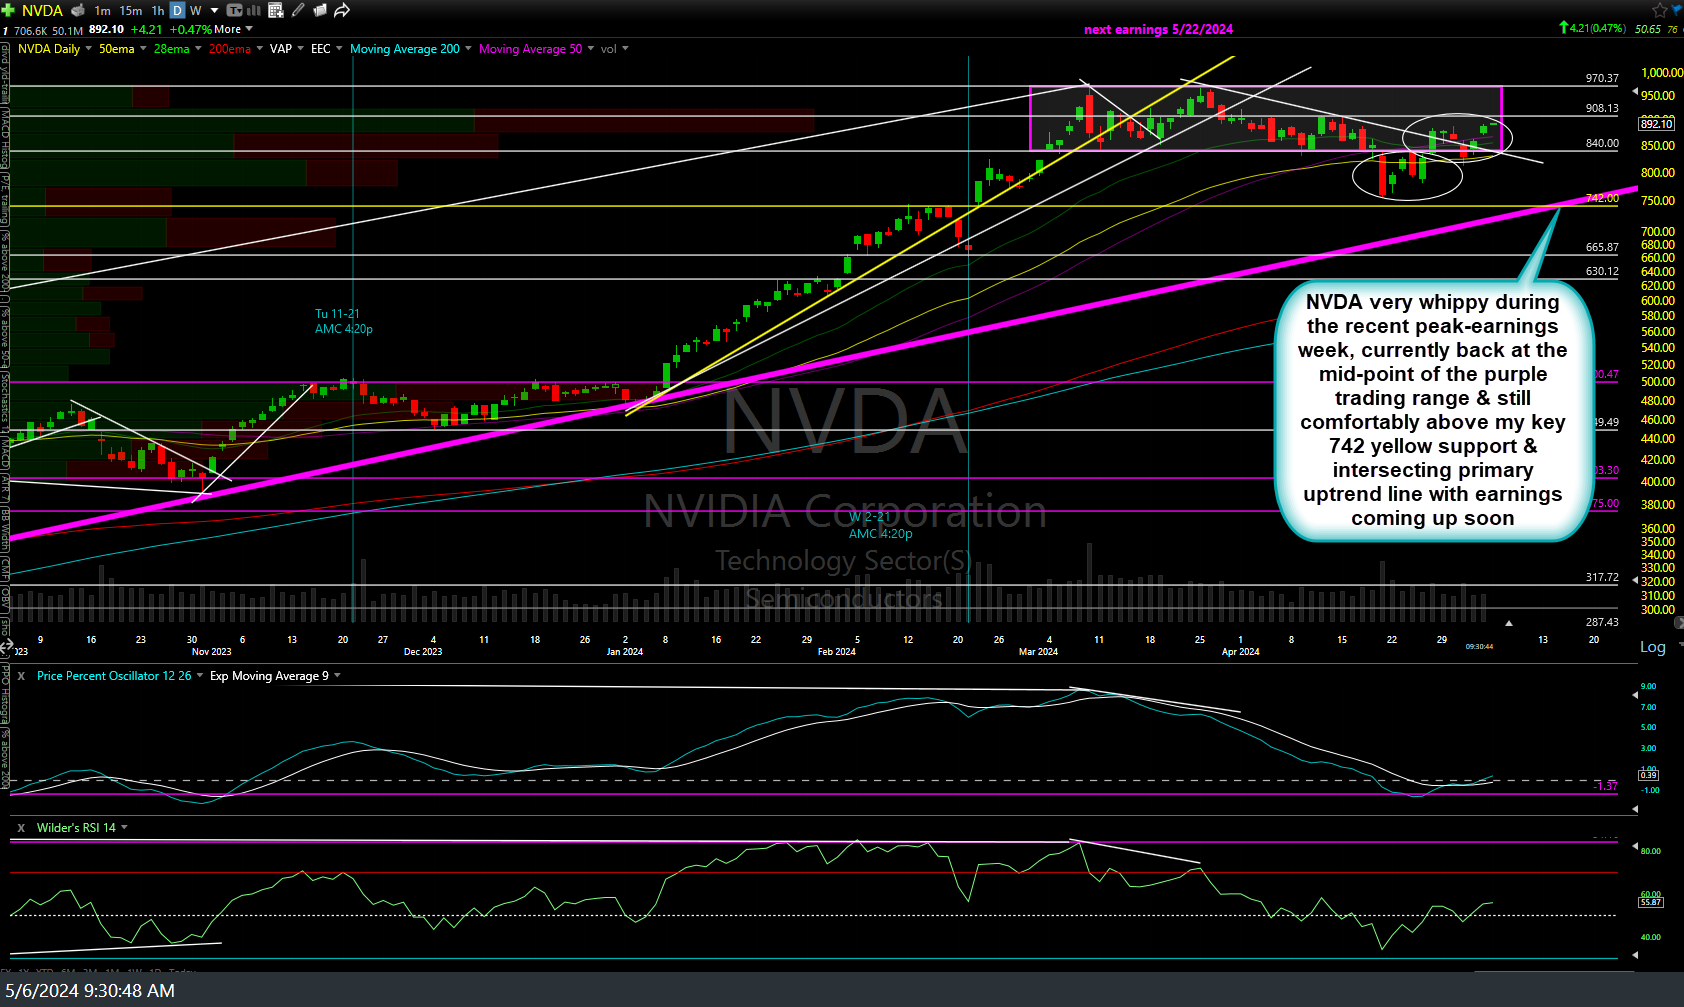
NVDA daily May 6th
GOOGL faded 1/2 (50% Fib retracement) of its earnings pop so far but still remains confortably above my key yellow 149ish support for now with the first decent support below current prices around the 159 level.
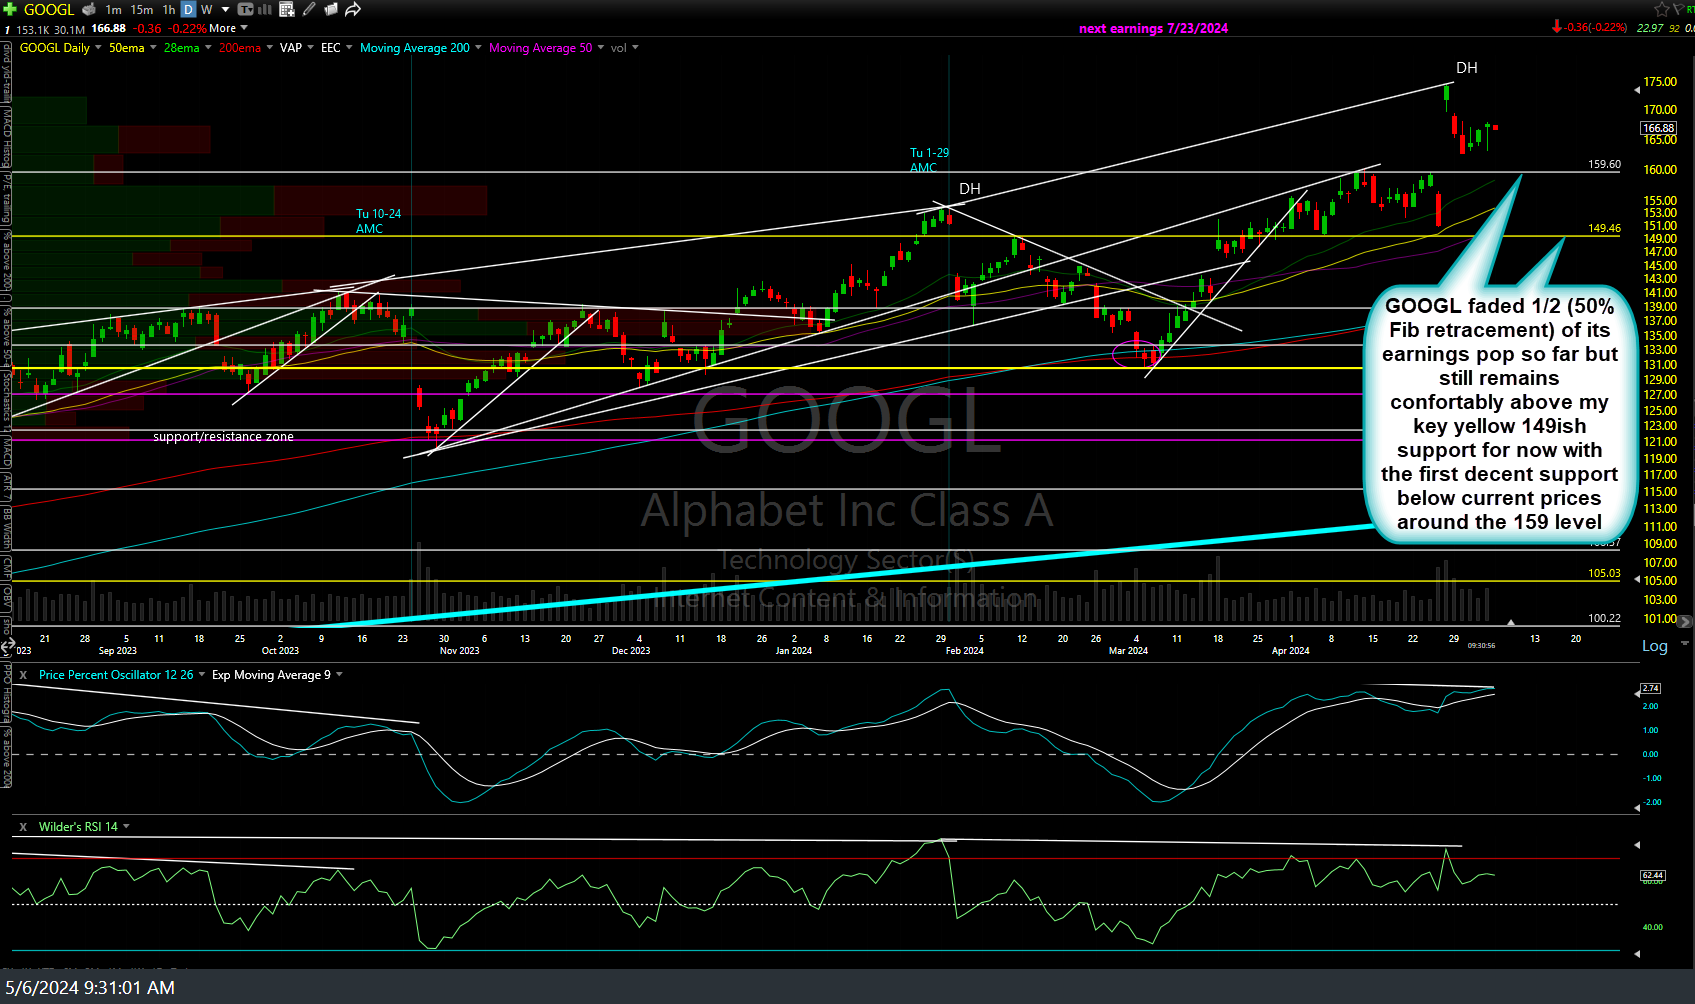
GOOGL daily May 6th
AMZN riding up this minor uptrend line on the first counter-trend rally following the recent divergent high & primary uptrend line breakdown with the next sell signal to come on a break below it. The intermediate-term trend is bullish when PPO above the zero line so on watch for a bearish cross below it.
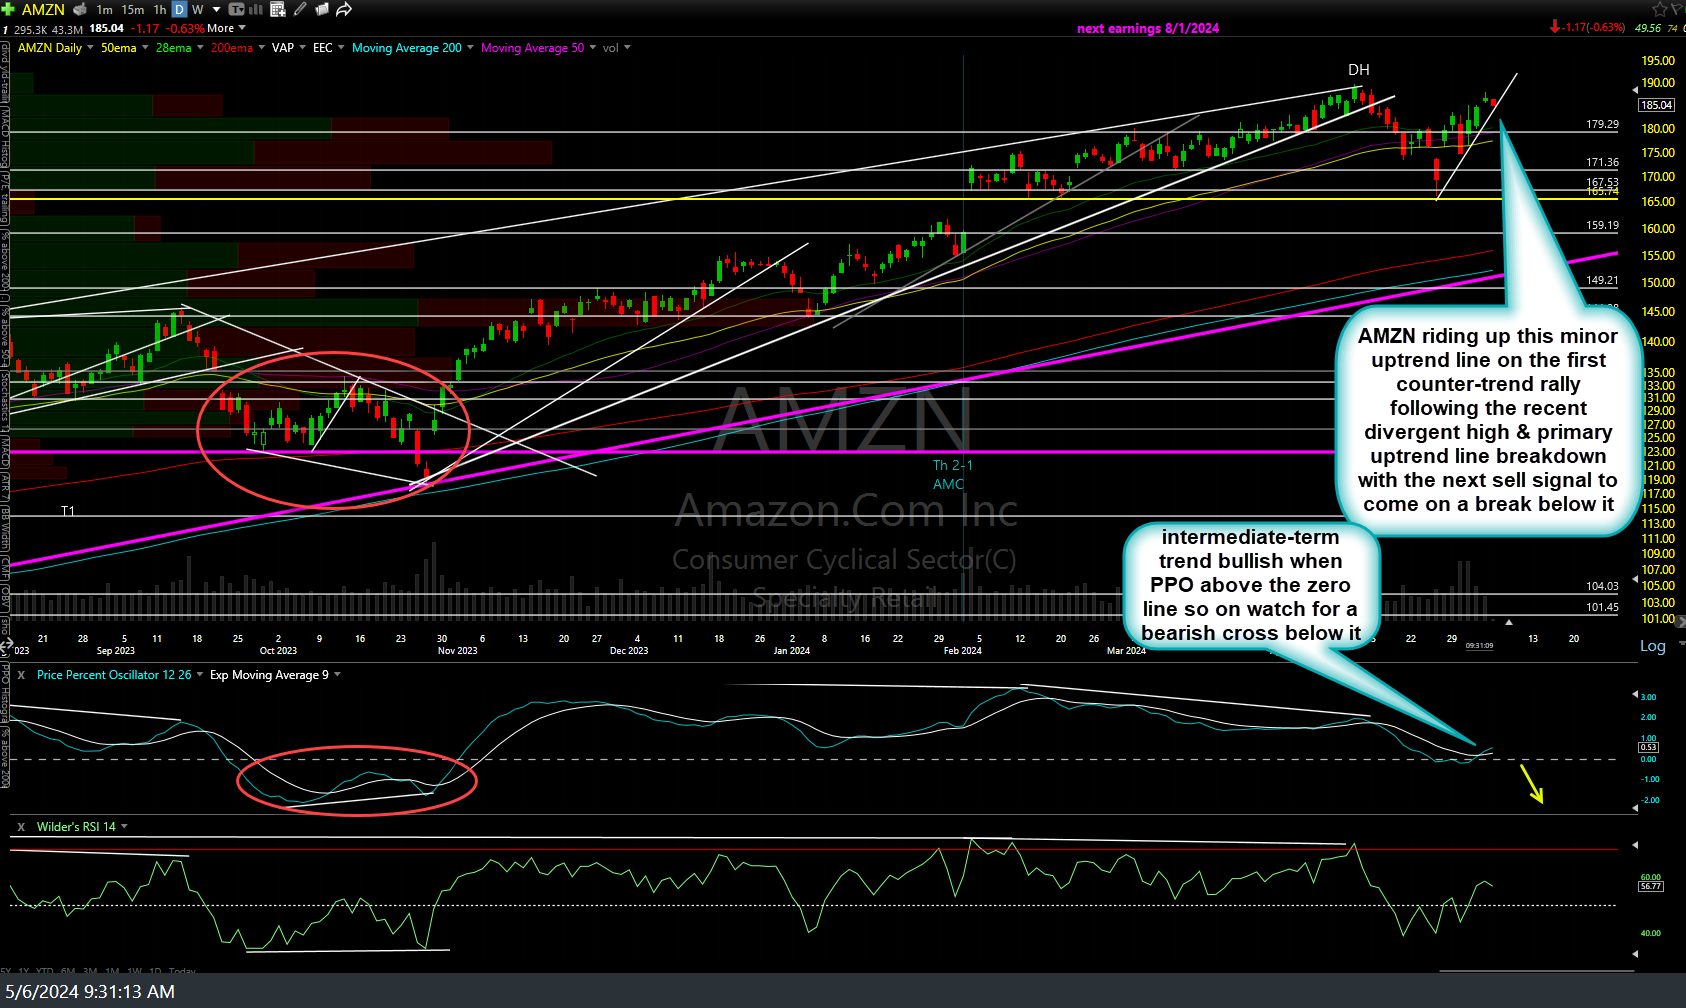
AMZN daily May 6th
META is backtesting the key 455ish (top of huge gap) former support, now resistance from below.

META daily May 6th
AVGO remains within the purple trading range (box), currently backtesting the 1238-1305 support/resistance zone (now resistance) from below: Bullish above the top of the range, bearish below it.
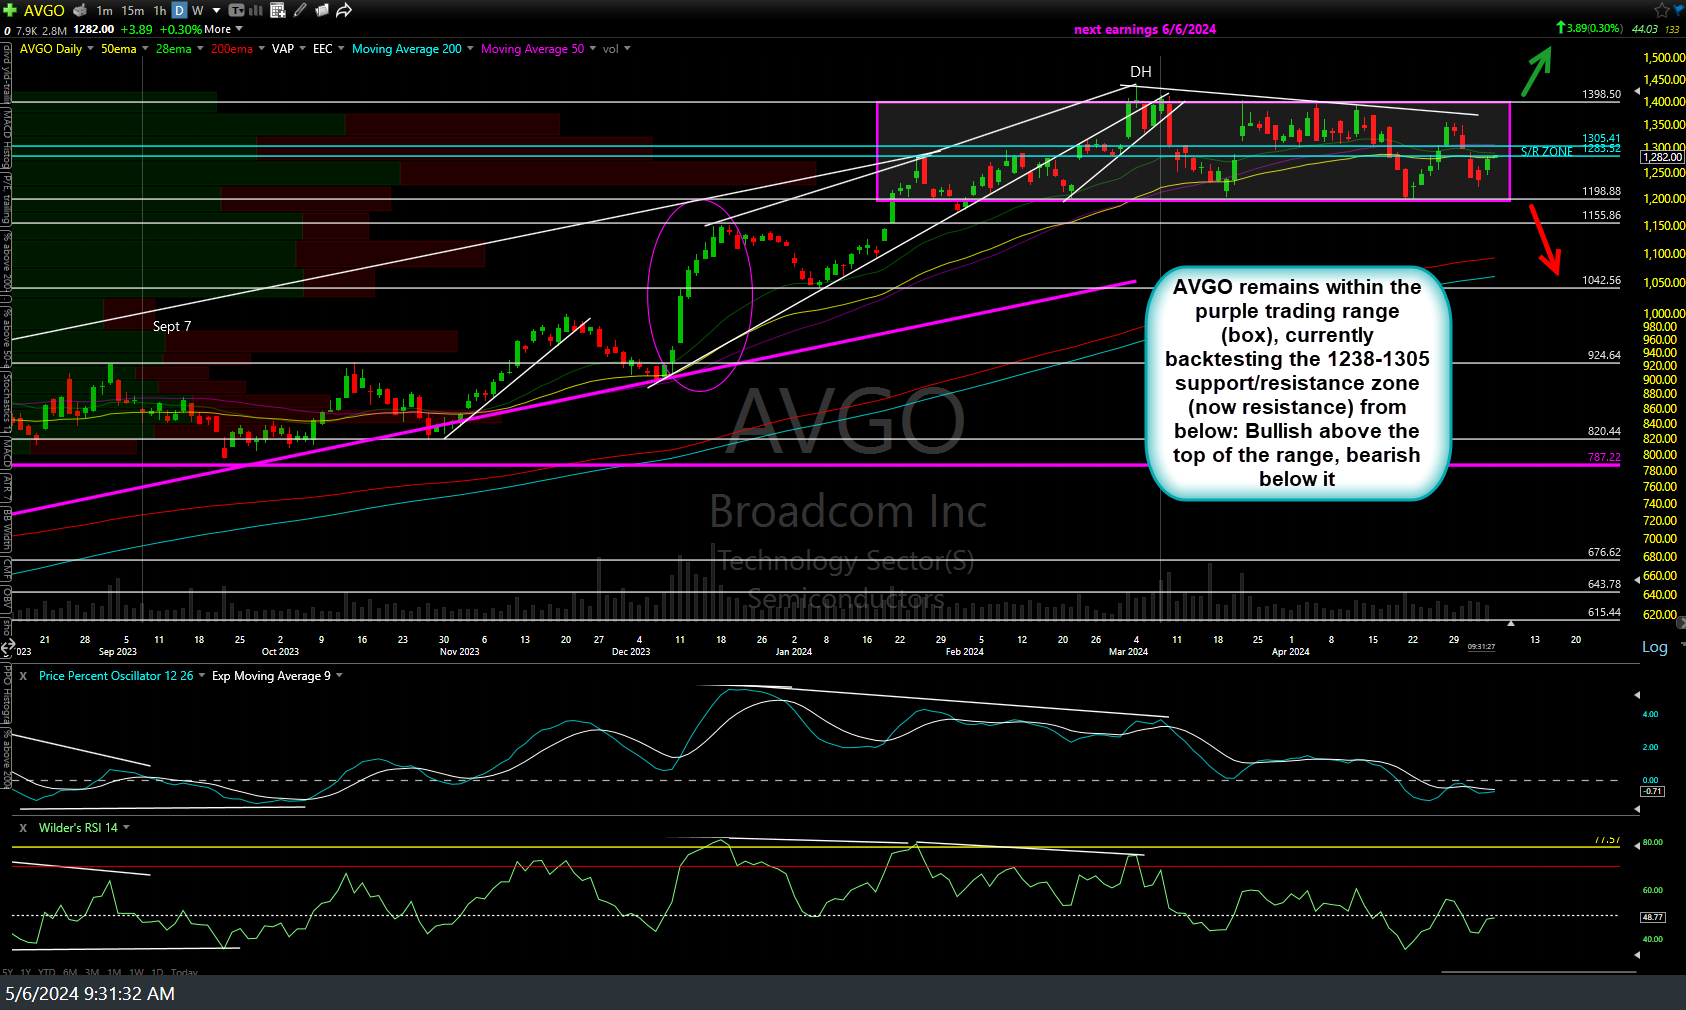
AVGO daily May 6th
TSLA rejected where I highlighted it would likely be (198ish resistance) in the video week before last, finding support at the 50-ema/175 price support following that rejection. As such, those are the 2 most important levels to watch at this time (bullish above 198, bearish below 175).

TSLA daily May 6th