
/NQ (Nasdaq 100 futures) has just hit my second price target, where the odds for a reaction are elevated, with the next sell signal to come on a solid break & 60-minute close below. Previous 60-minute chart from last Wednesday & the updated 60-minute chart below.
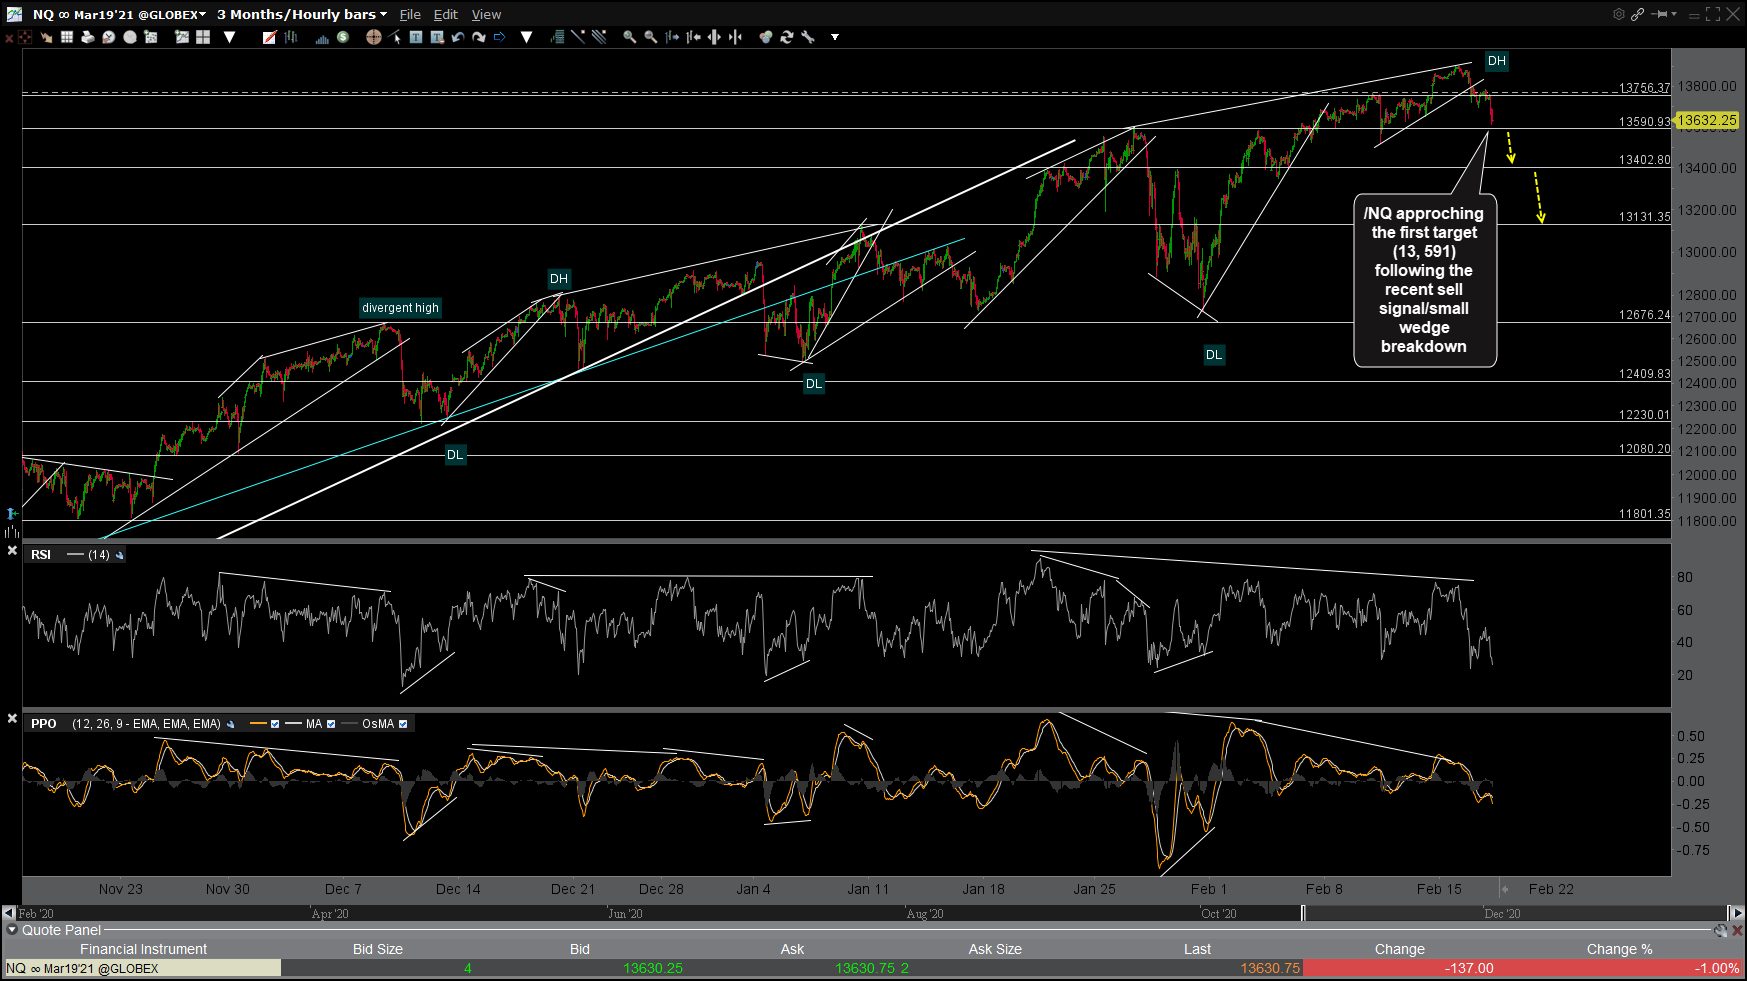
NQ 60m Feb 17th
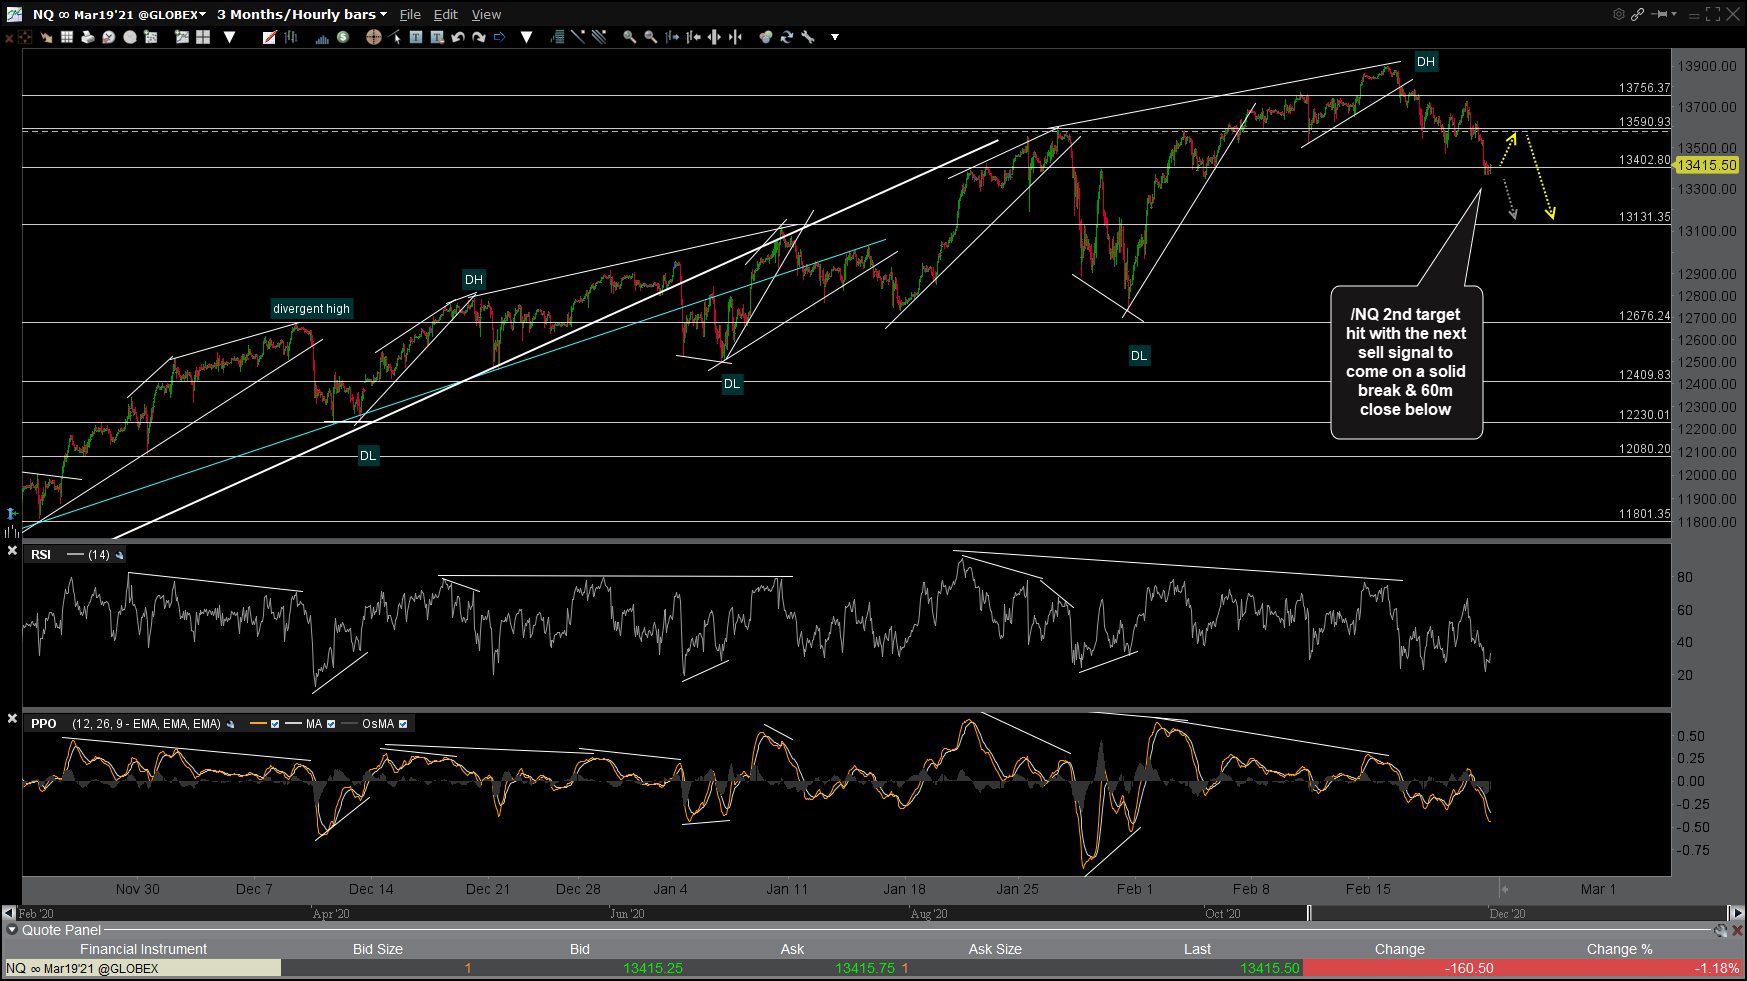
NQ 60m Feb 22nd
Likewise, /ES (S&P 500 futures) continues to roll over following the divergent high + trendline breakdown & backtest.
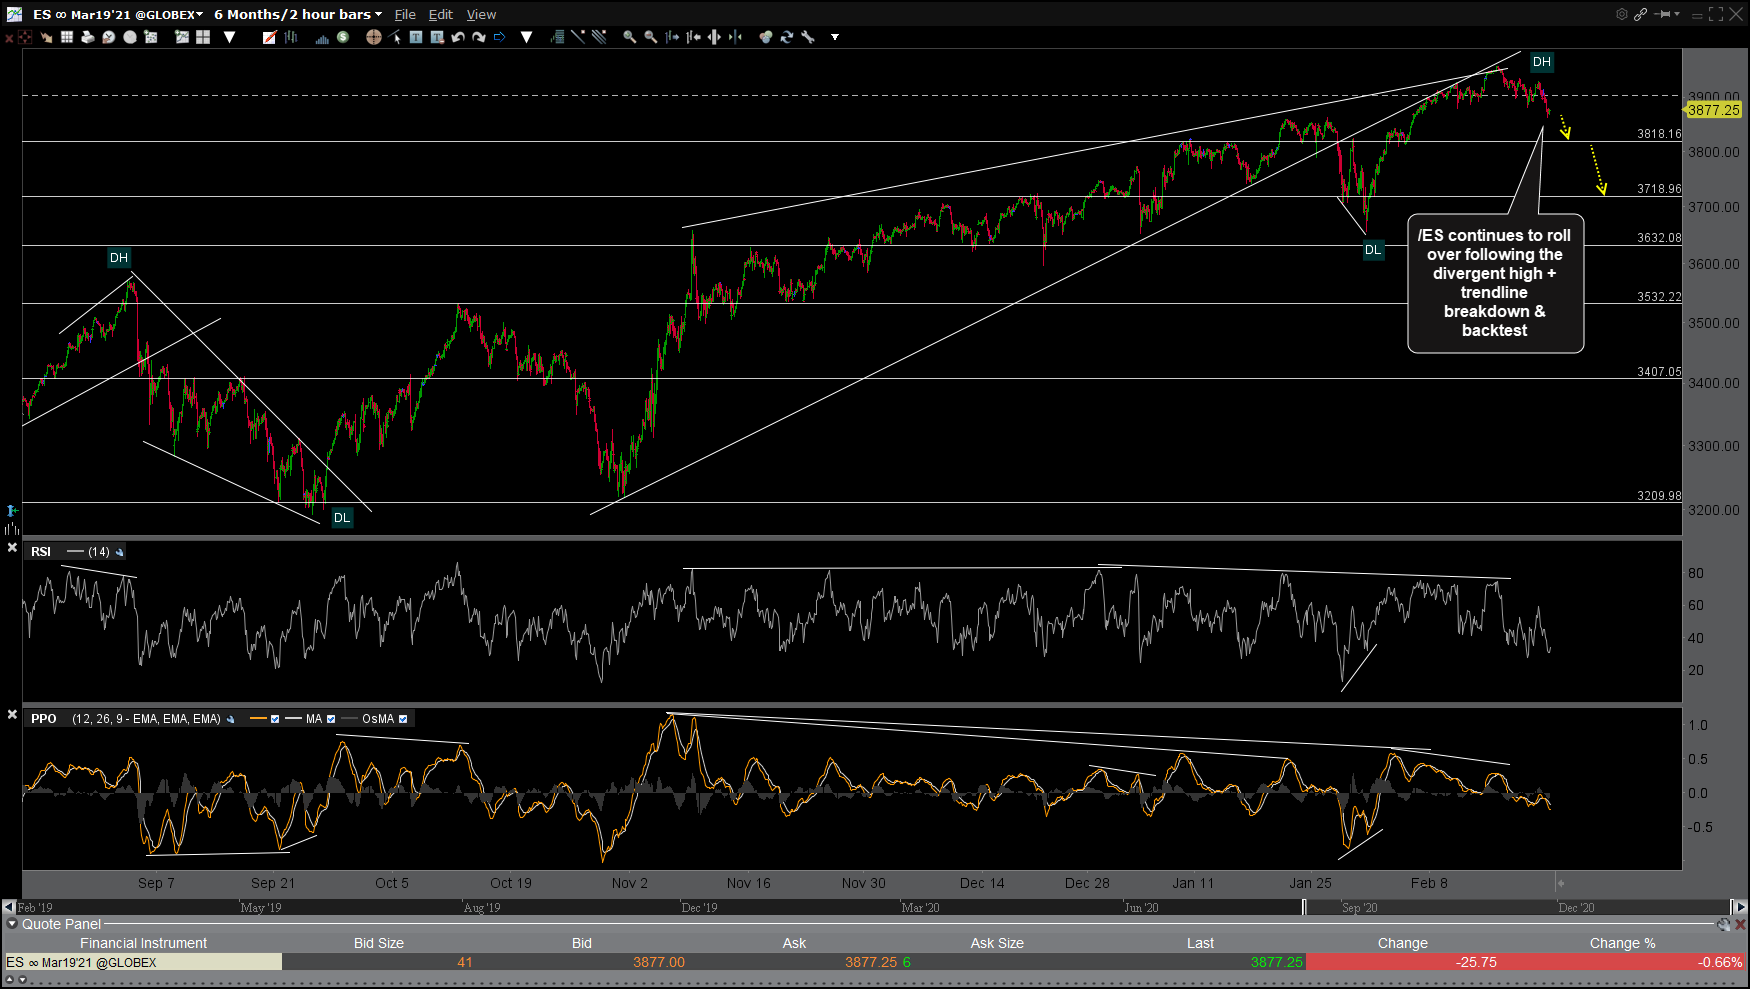
ES 60m Feb 22nd
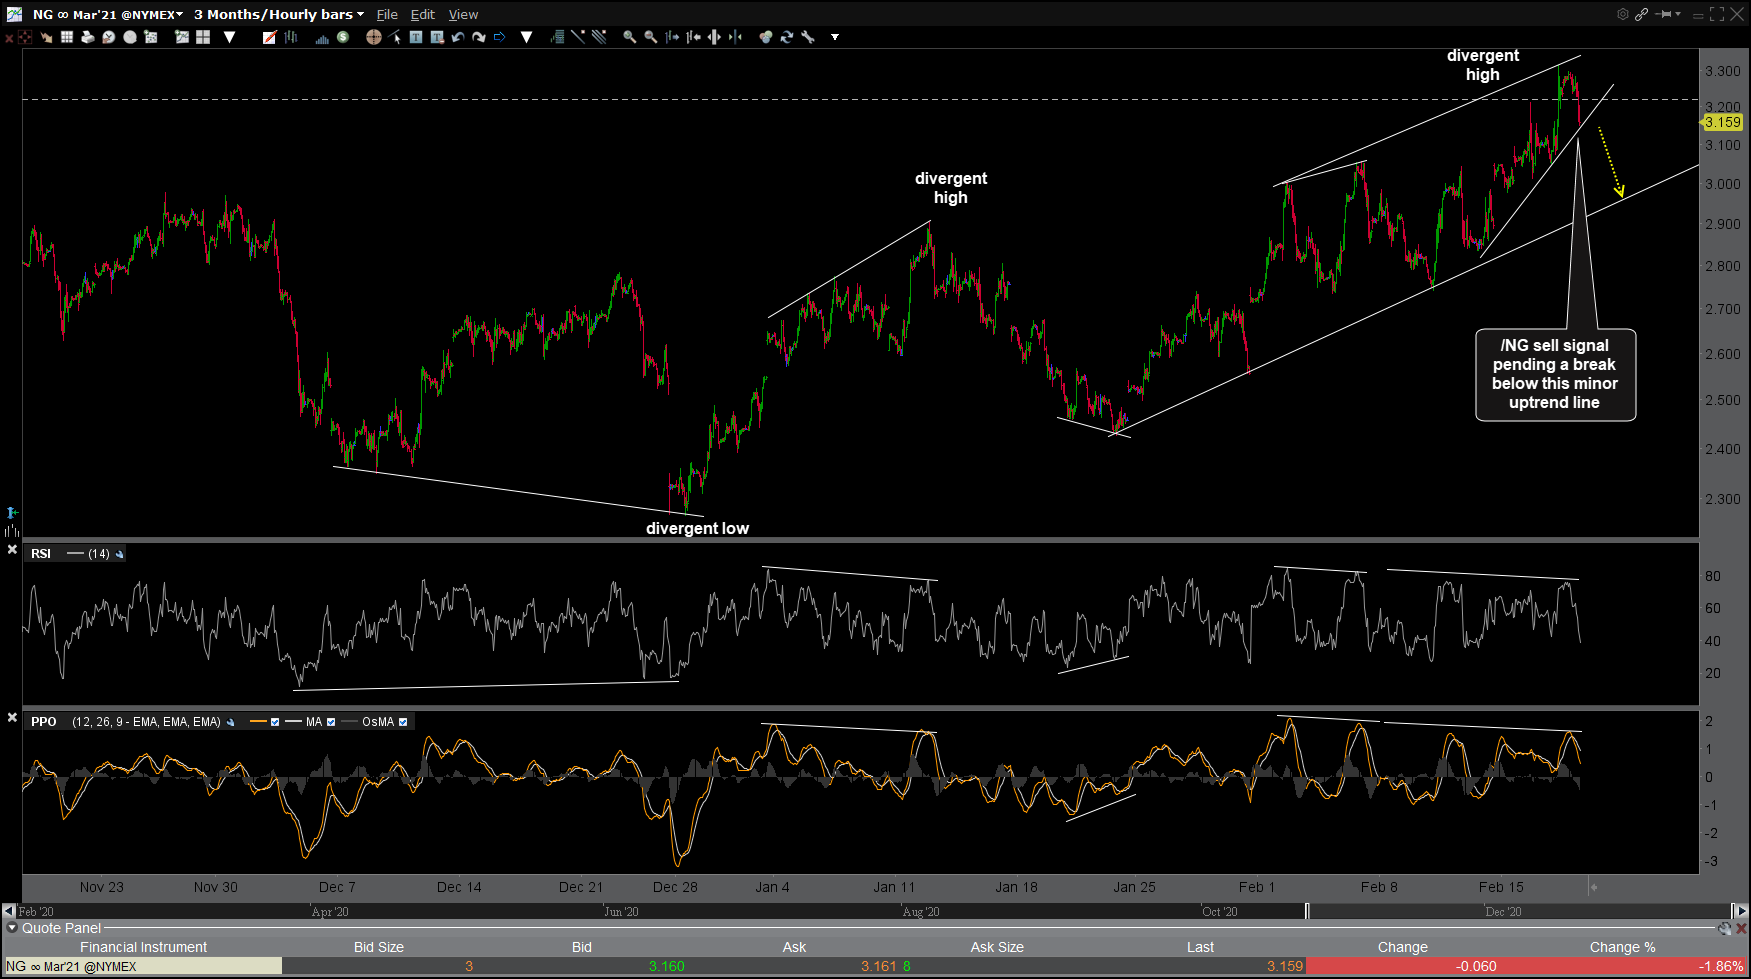
/NG (natural gas futures) pullback (uptrend line) has also been hit this morning for a quick 5%+ gain. Previous (Thursday’s) & updated 60-minute charts below.
NG 60m Feb 18th.png
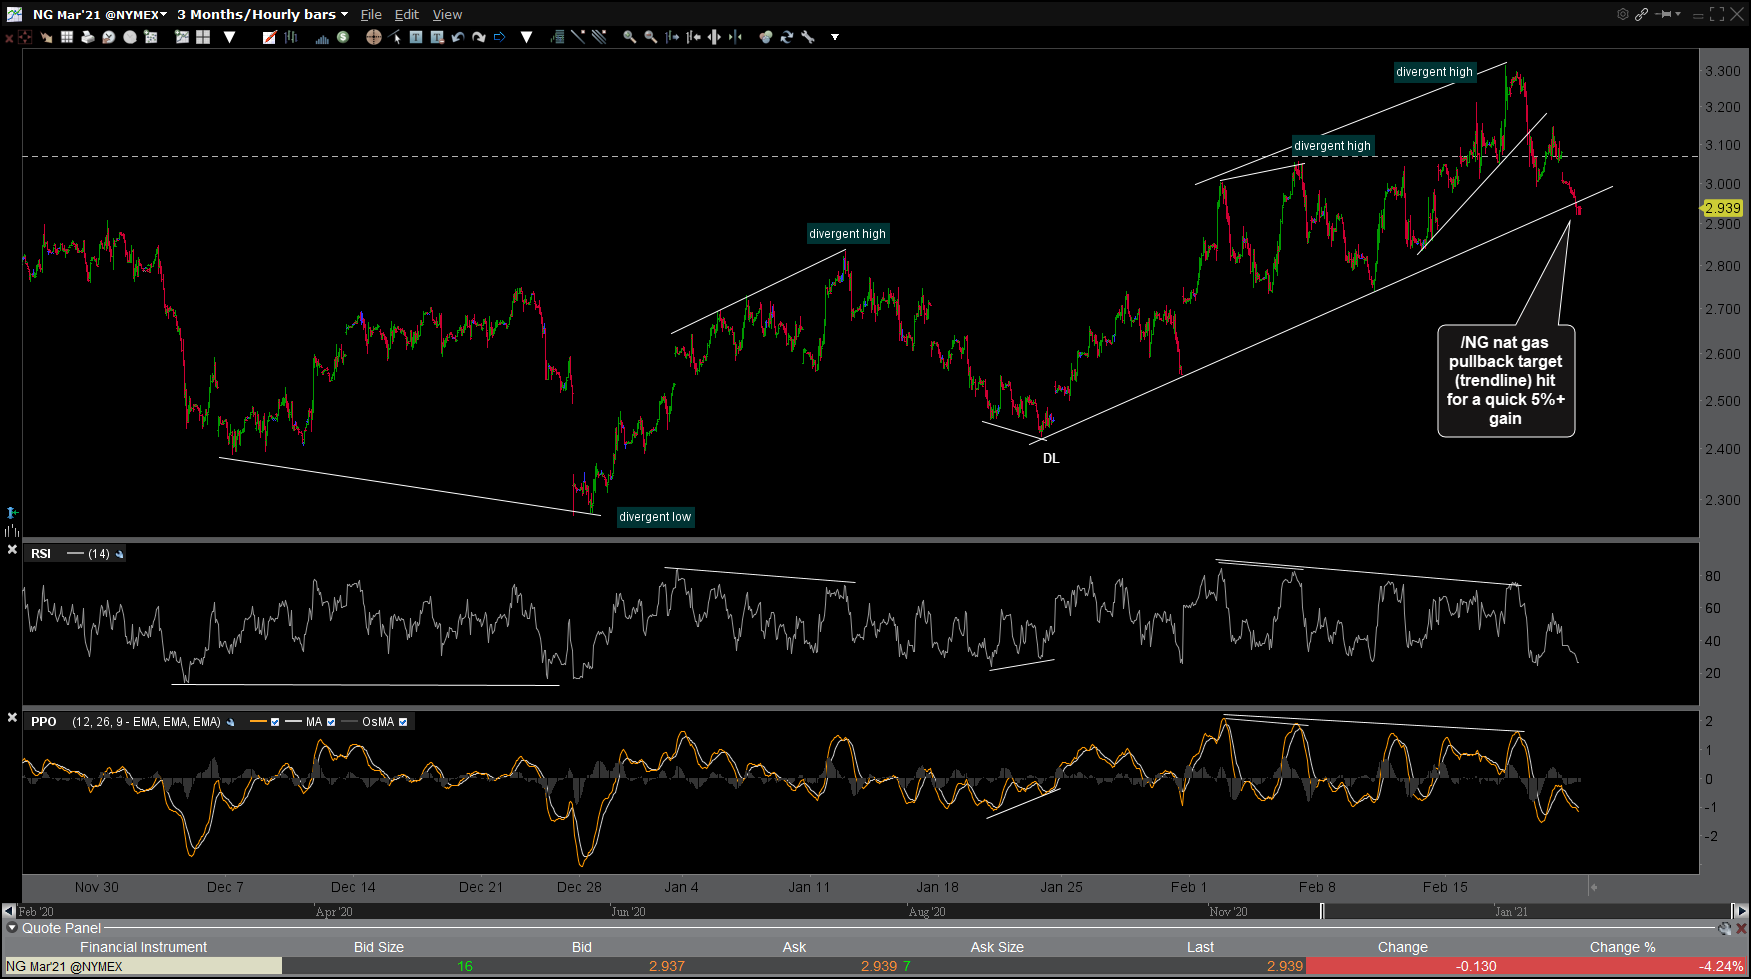
NG 60m Feb 22nd
I’ll follow up with charts of the major stock index ETFs later today once we see how the markets, as well as the big FAAMG+T stocks, are trading in the regular session.