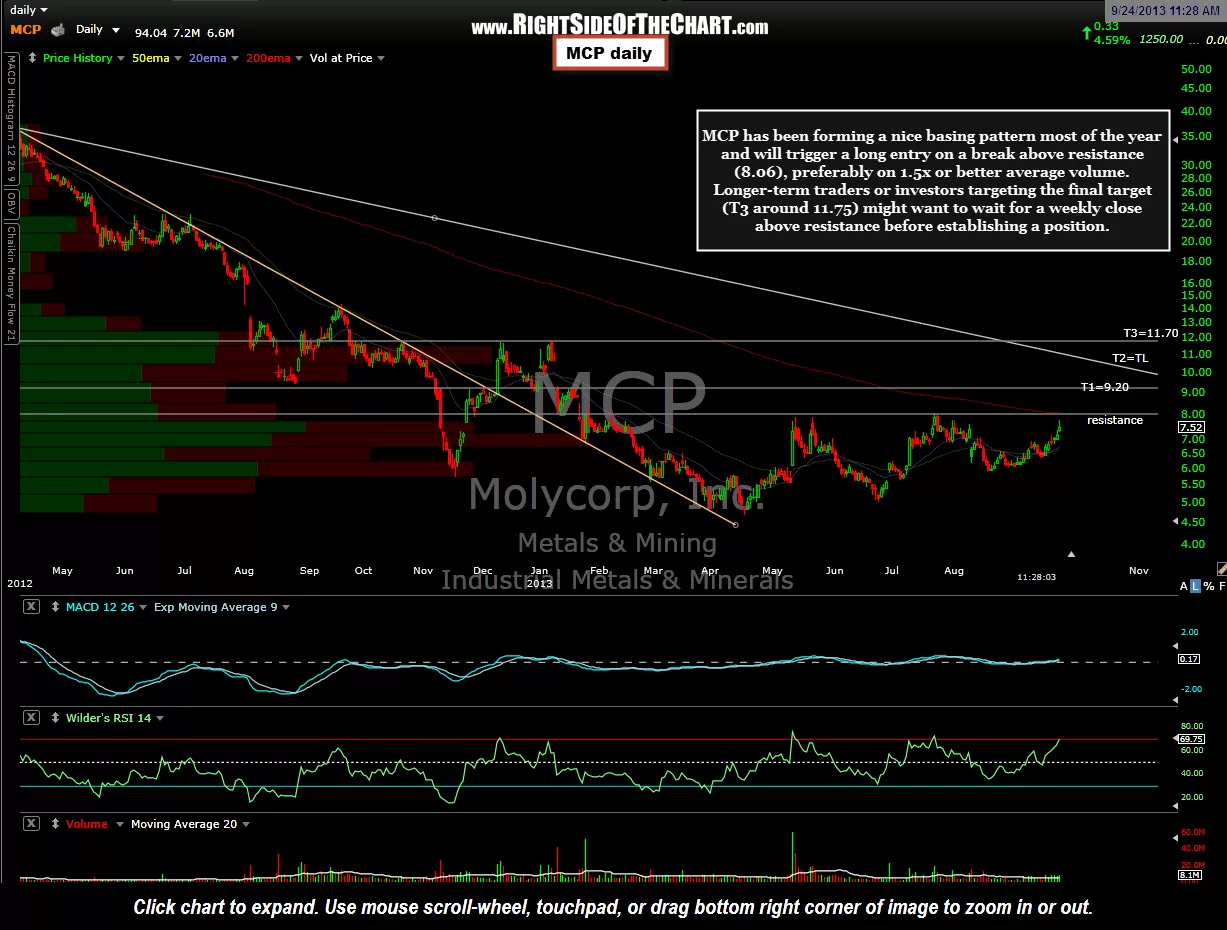
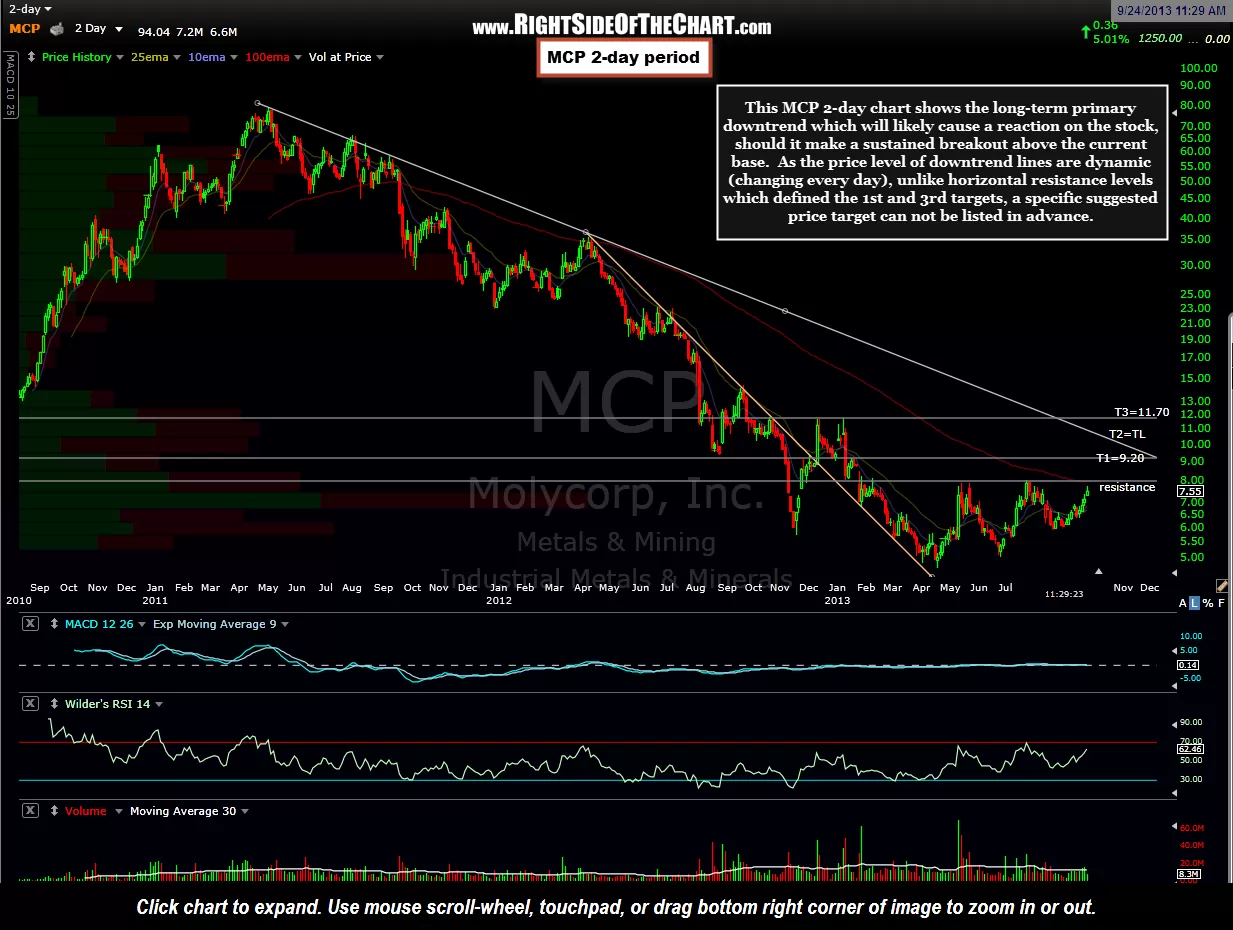
MCP will be added a both a Long Trade Setup as well as a Long-Term Trade Setup (click on the links for descriptions of both). Molycorp has been forming a nice basing pattern most of the year and will trigger a long entry on a break above resistance (8.06), preferably on 1.5x or better average volume. Longer-term traders or investors targeting the final target (T3 around 11.75) might want to wait for a weekly close above resistance before establishing a position. This MCP 2-day chart shows the long-term primary downtrend which will likely cause a reaction on the stock, should it make a sustained breakout above the current base. As the price level of downtrend lines are dynamic (changing every day), unlike the horizontal resistance levels which define the 1st and 3rd targets, a specific suggested price target can not be listed in advance. Daily & 2-day period charts.

Results for {phrase} ({results_count} of {results_count_total})
Displaying {results_count} results of {results_count_total}