
$VIX (CBOE Market Volatility Index) appears poised to rally following a solid break above this bullish falling wedge pattern following this most recent divergent low (note the rallies that followed the previous divergent lows). Significant rallies in the $VIX typically coincided with significant corrections in the stock market so one to watch in the coming days/weeks. There are several proxies fro trading the $VIX including VXX, VIXY, VIXM, $VIX futures & futures options, etc…

$VIX daily Aug 19th
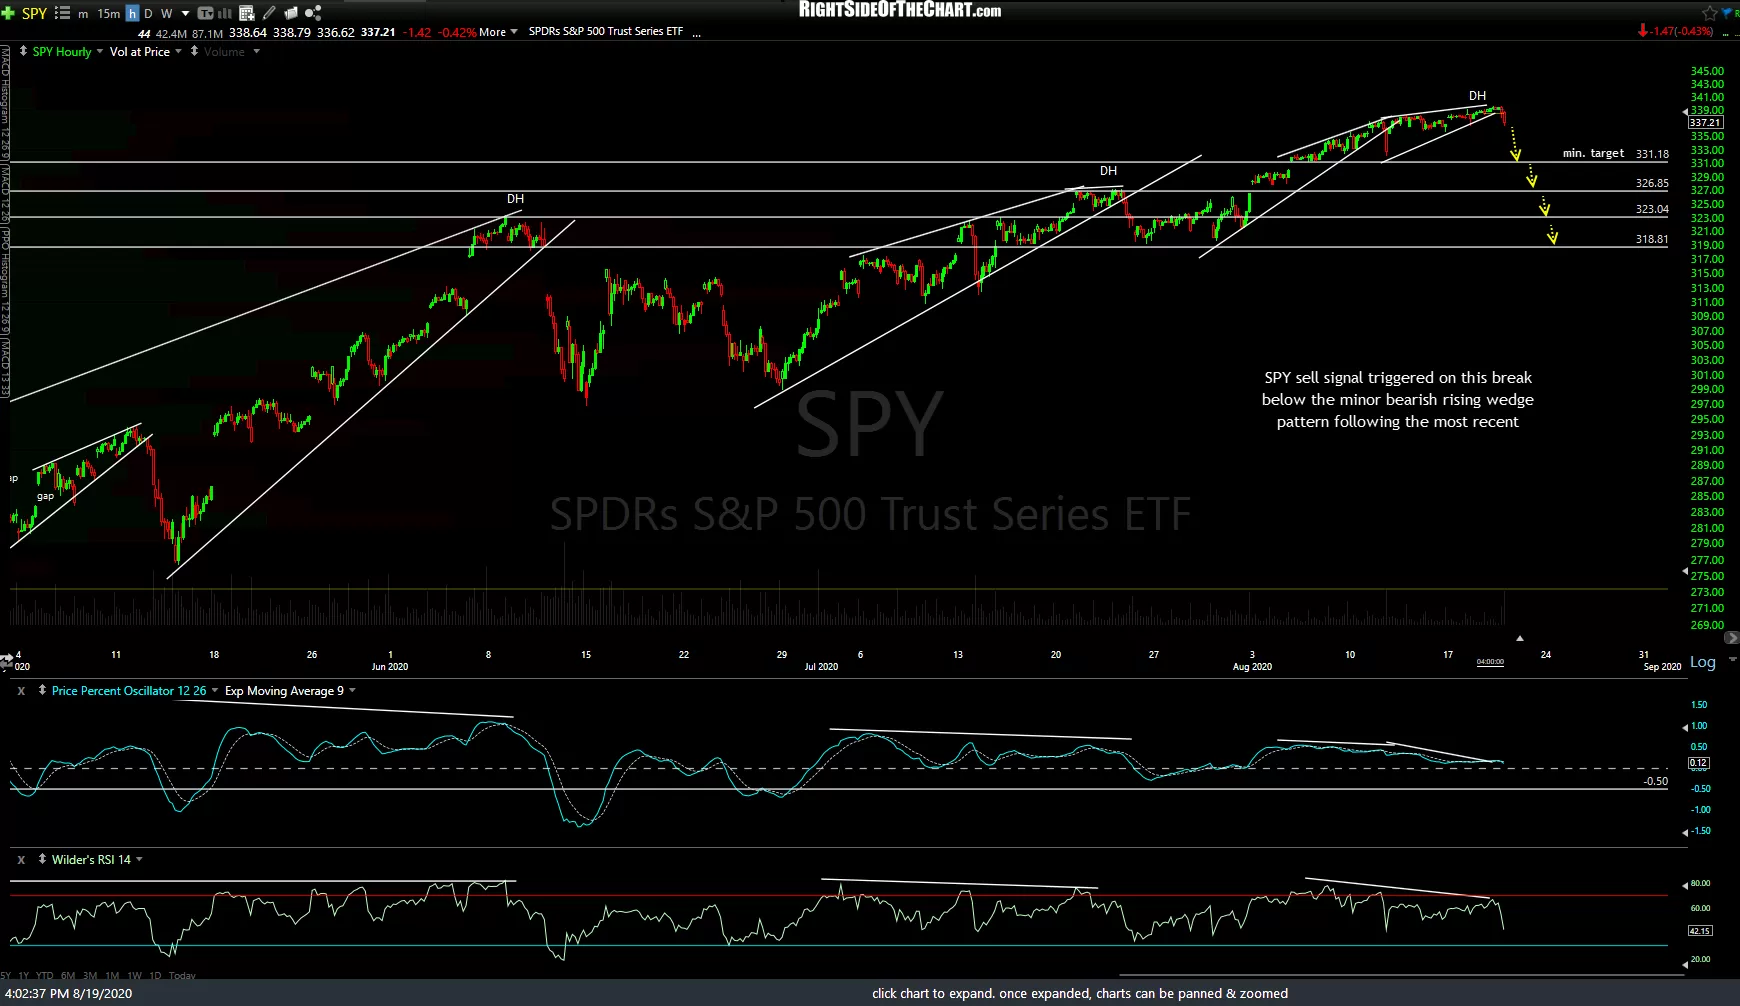
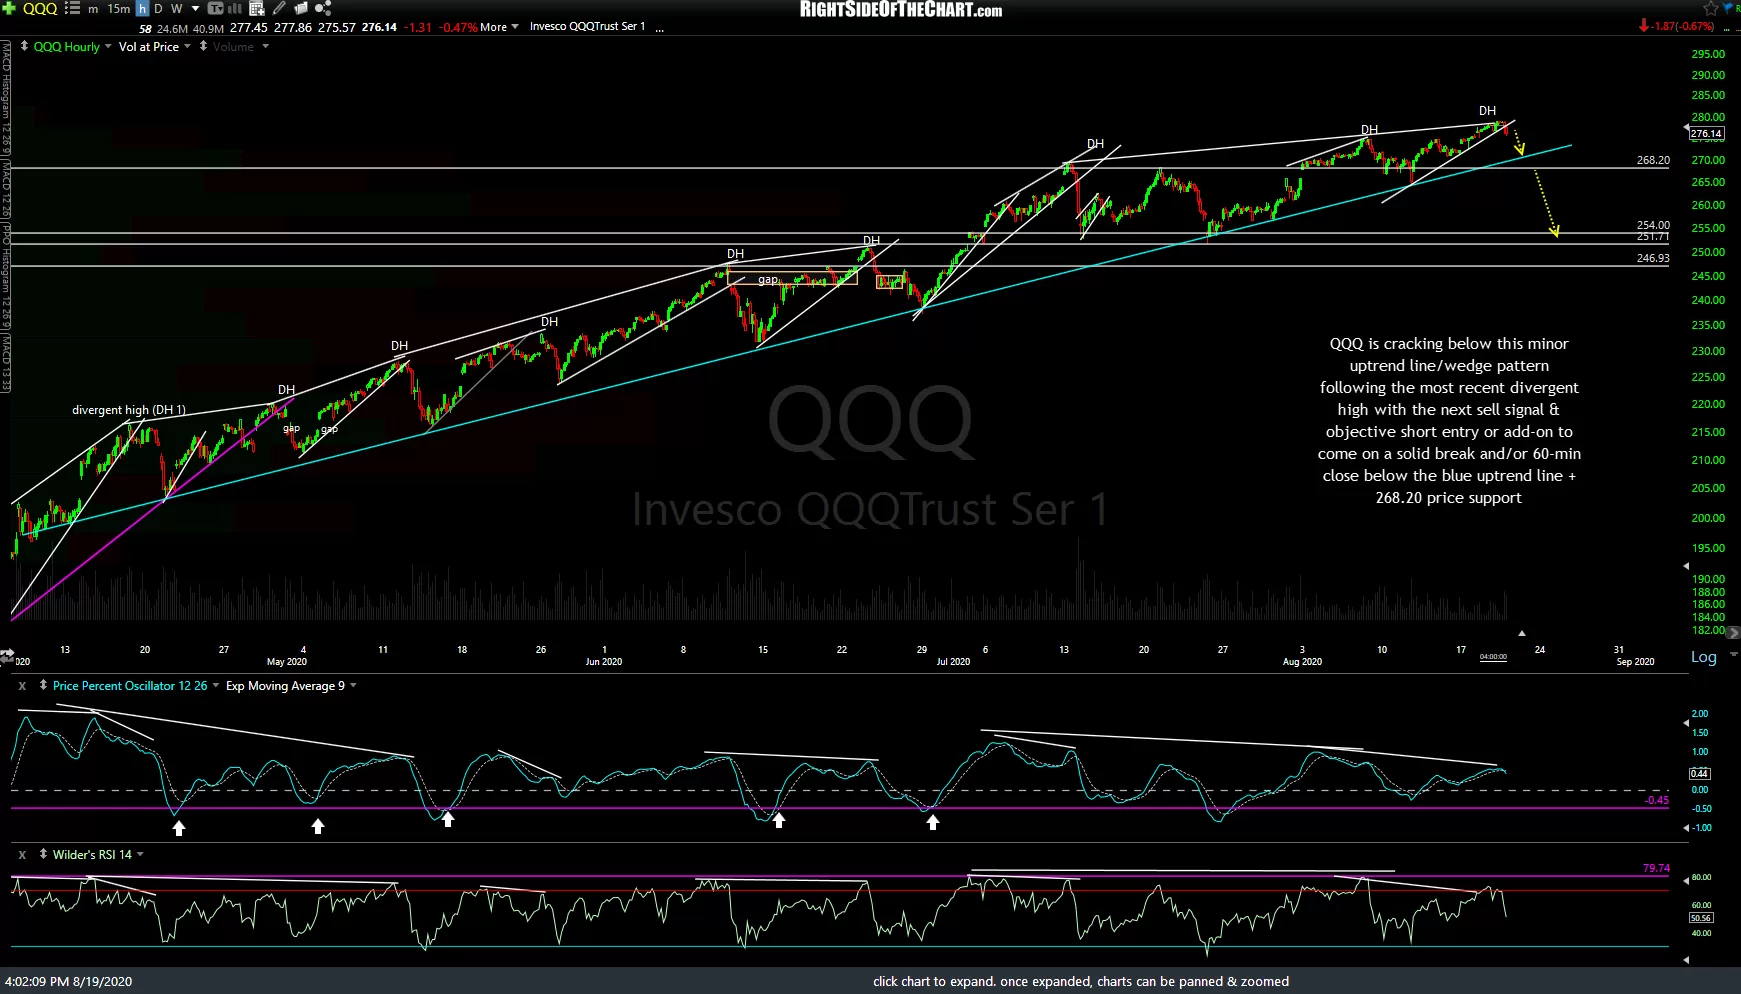
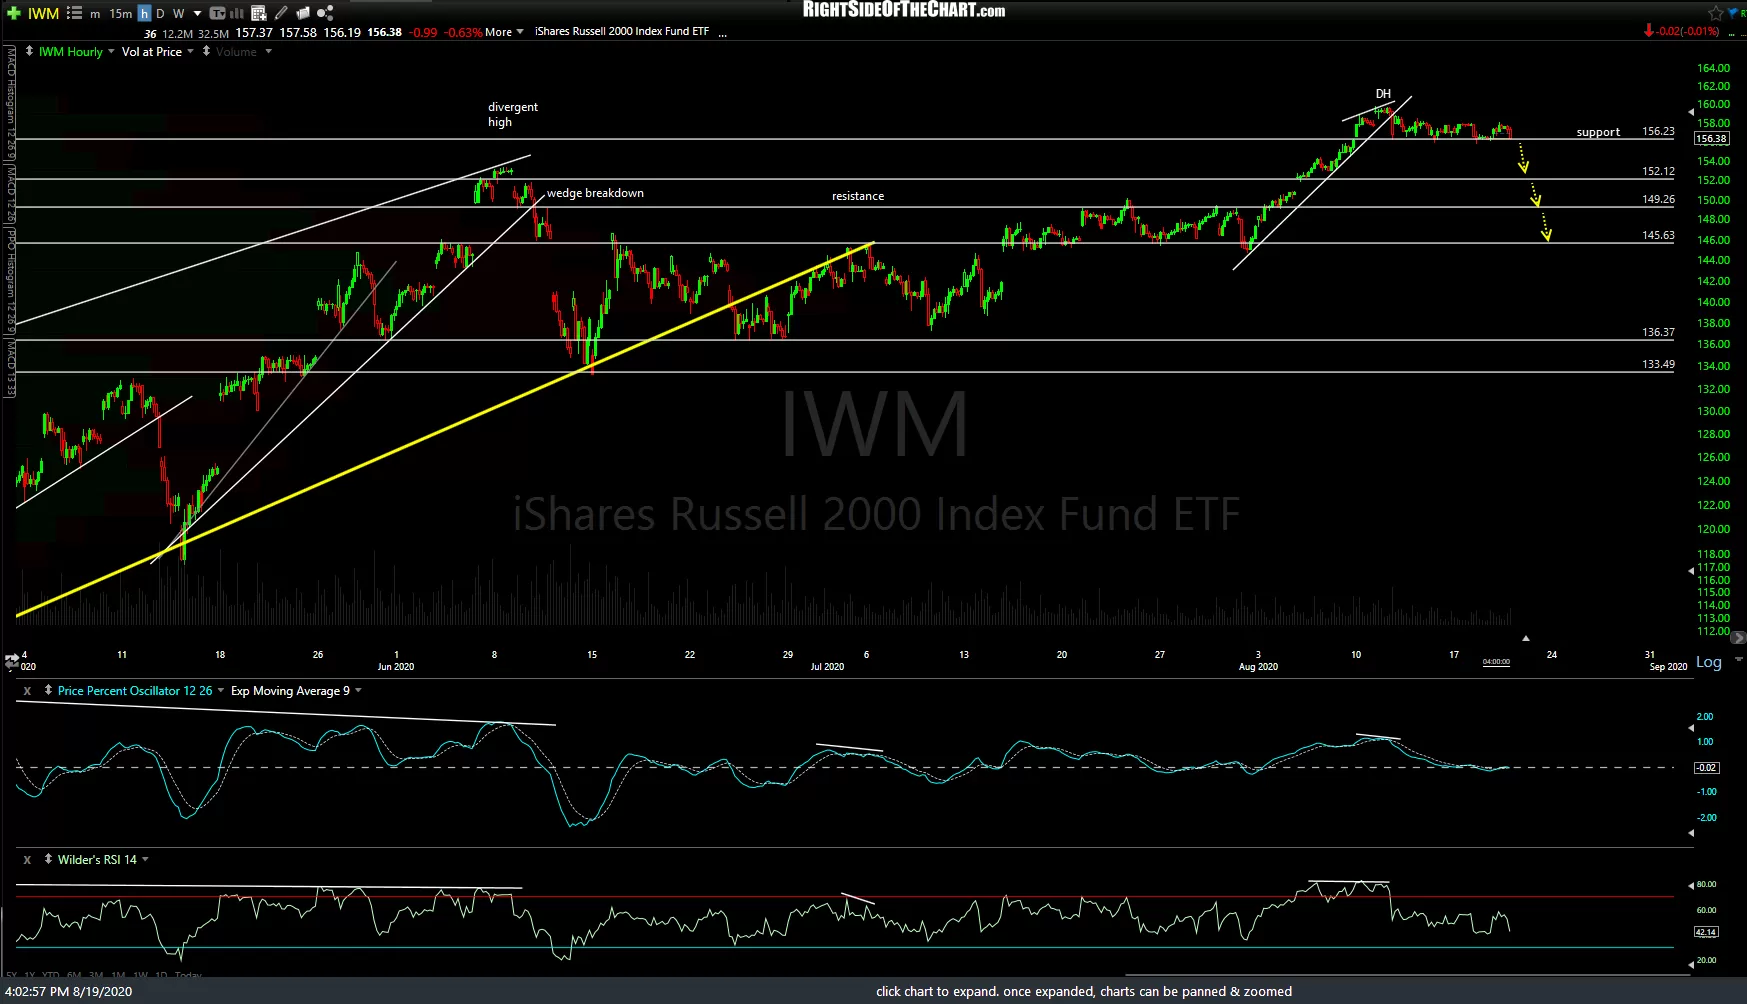
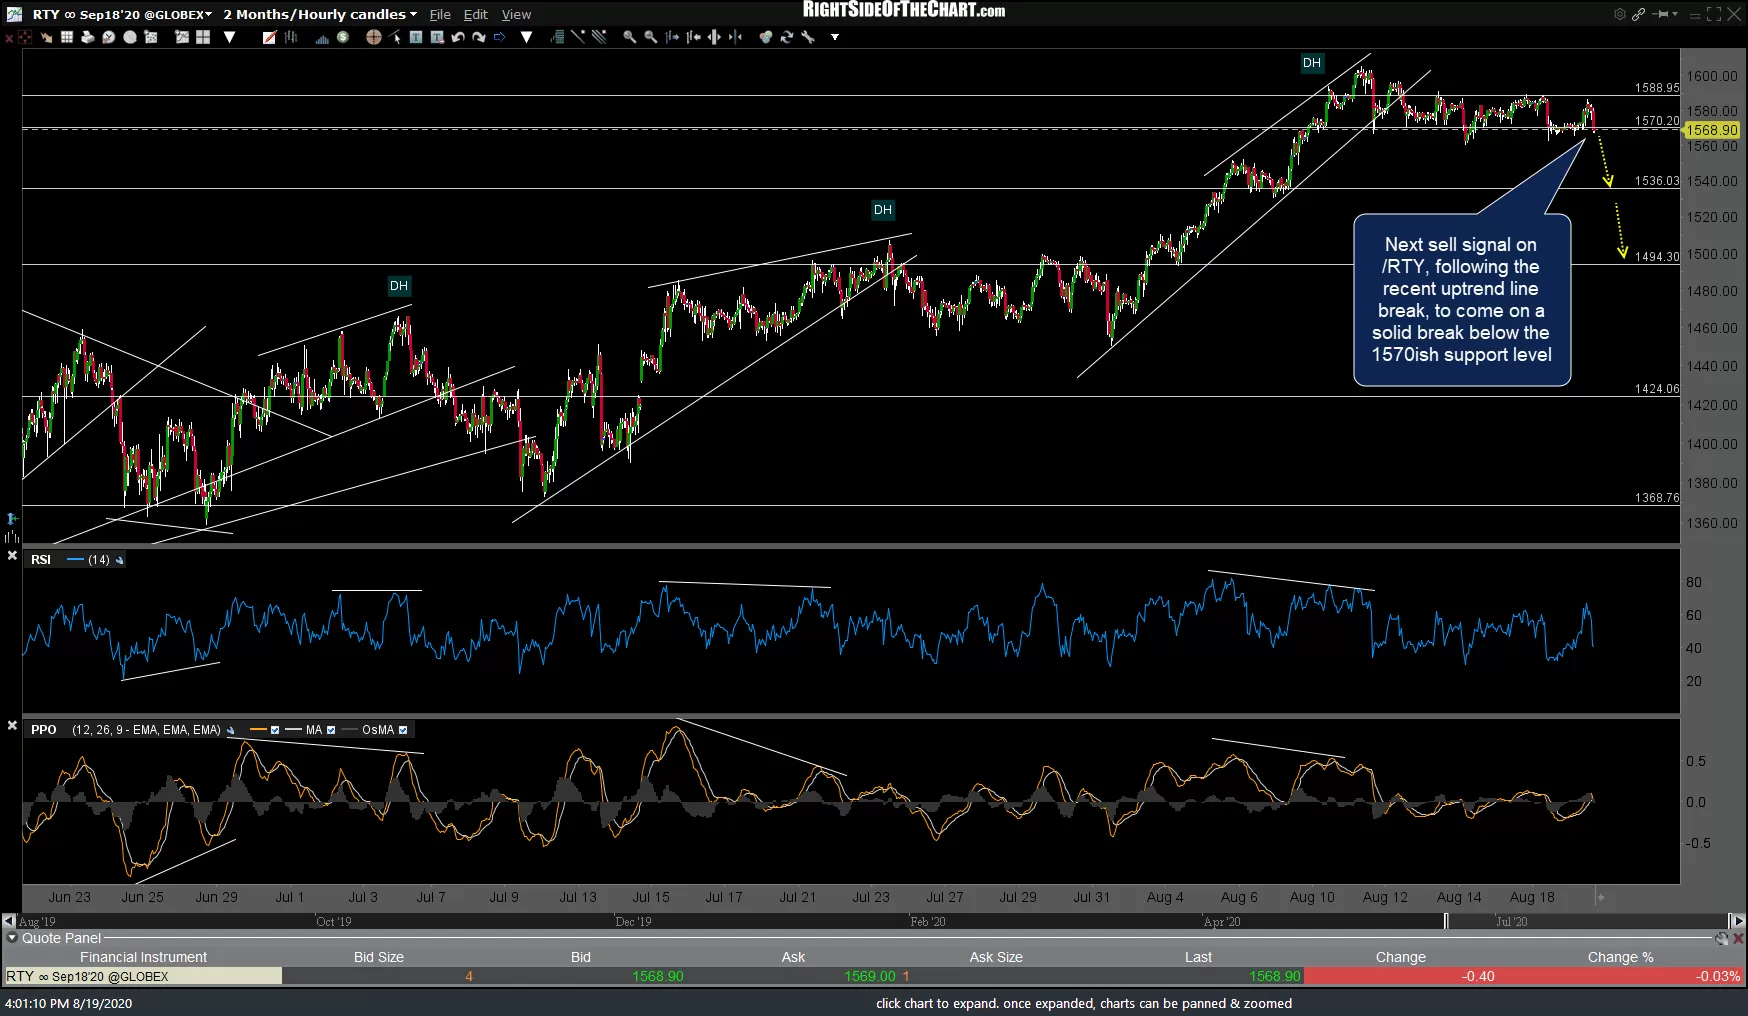
Best to wait for some half-decent or better sell signal on the major stock indices to help confirm a long entry on the $VIX which could come sooner than later. The following 60-minute charts of SPY, QQQ, IWM, /ES, /NQ, & /RTY (S&P 500, Nasdaq 100, & Russell 2000 Index ETFs & futures) below show all three indices trading on or just below some near-term trendlines & price support levels which will trigger the next sell signals if & when taken out with conviction.
-

- SPY 60m Aug 19th
-
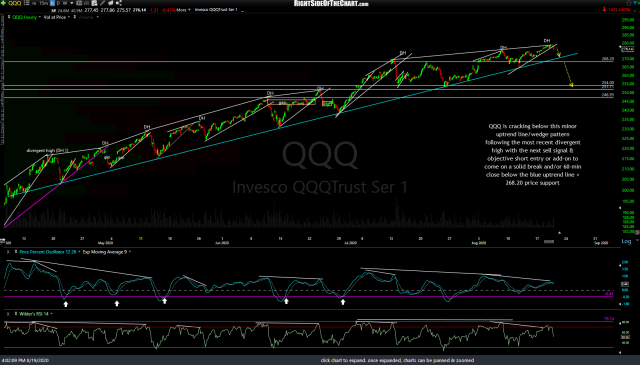
- QQQ 60m Aug 19th
-

- IWM 60m Aug 19th
-

- ES 60m Aug 19th

-
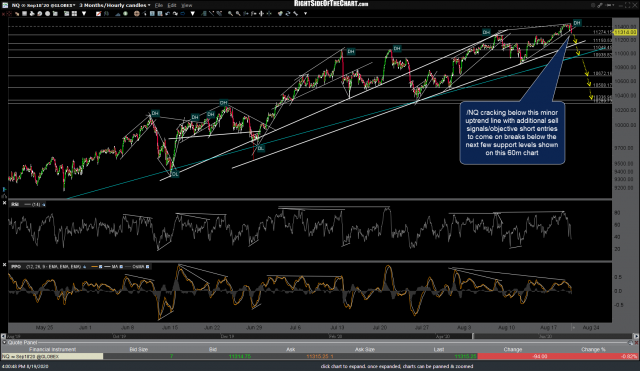
- NQ 60m Aug 19th

-

- RTY 60m Aug 19th
On a PC or Mac, click on the first chart above to expand, then click on the arrow to the right of each chart to advance to the next expanded chart. Once expanded, the charts can be panned & zoomed for additional detail. Mobile & tablets can pinch-zoom to expand the charts.