
SPY continues to backtest this uptrend line on the daily chart from below & remains below the July 27th bearish engulfing candle & divergent high: Bullish if SPY can make a solid recovery and daily close back above the trendline, bearish if we get an impulsive rejection off the trendline soon. Again, any marginal new high (above the July high) soon will still be a divergent high & likely result in a failed breakout while a break below the Aug 18th low would likely open the door to a much larger selloff.
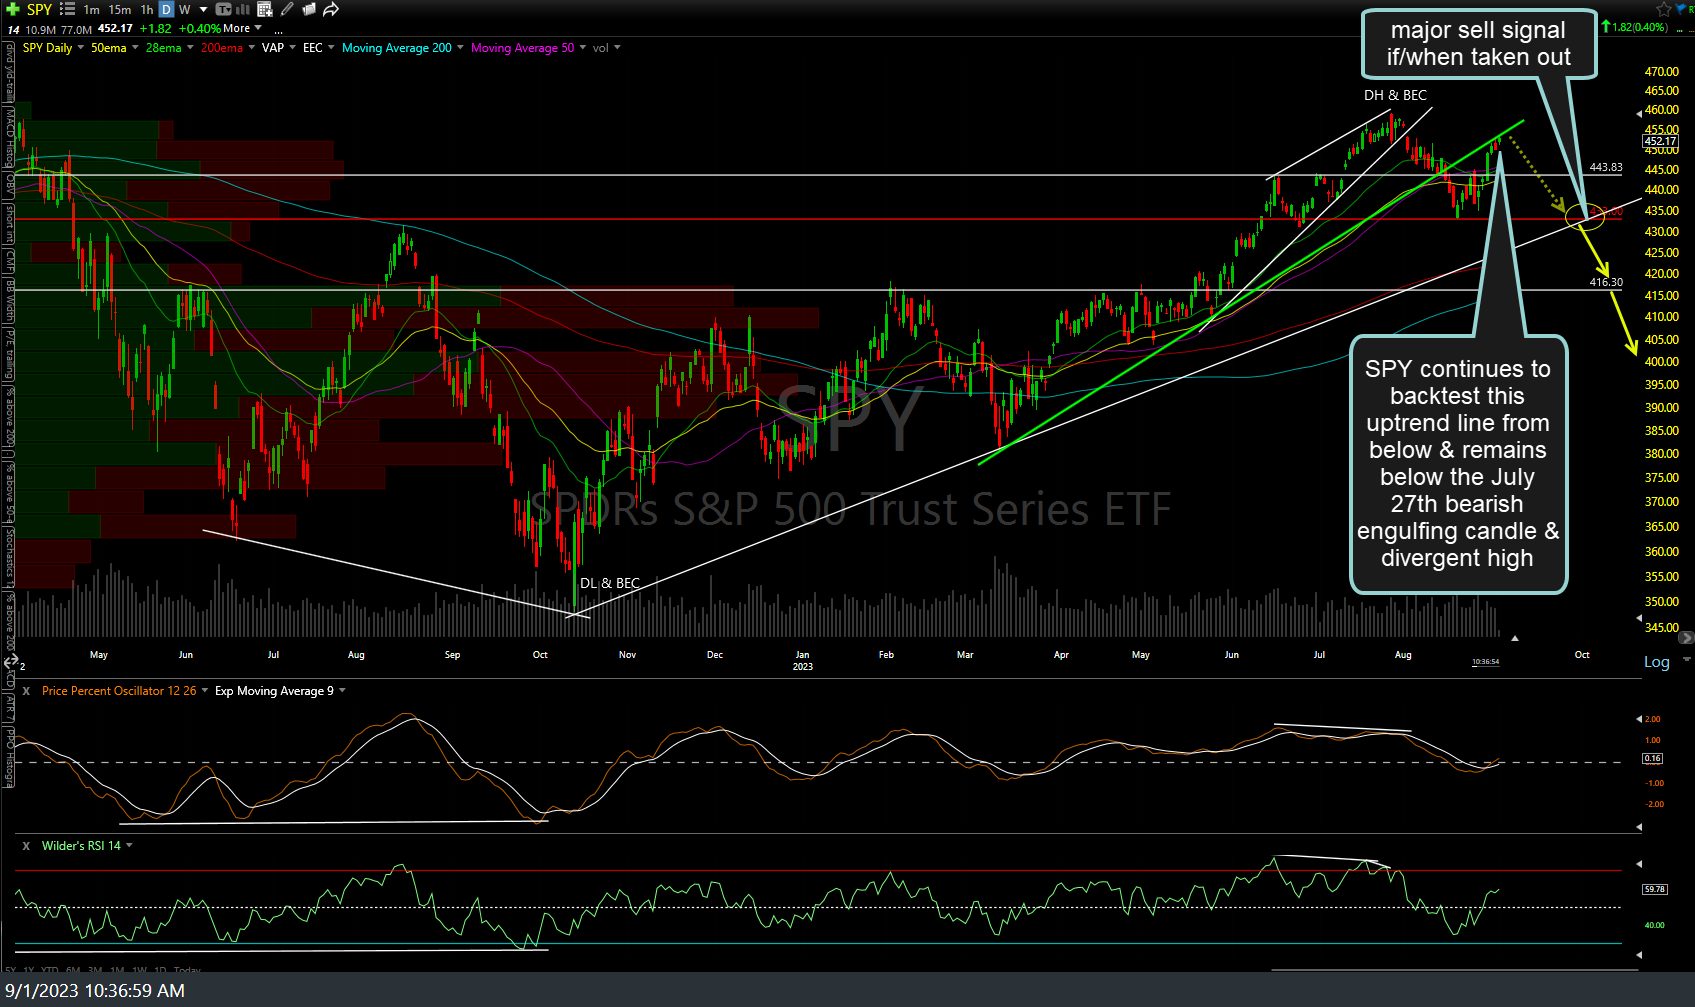
SPY daily Sept 1st
QQQ is flat on the day but still above the downtrend line, for now: Bullish as long as it remains above, bearish if it falls back below it (failed breakout). Should the breakout fail, additional sell signals will come on breaks below each of the levels marked at the arrow breaks on the daily chart below.
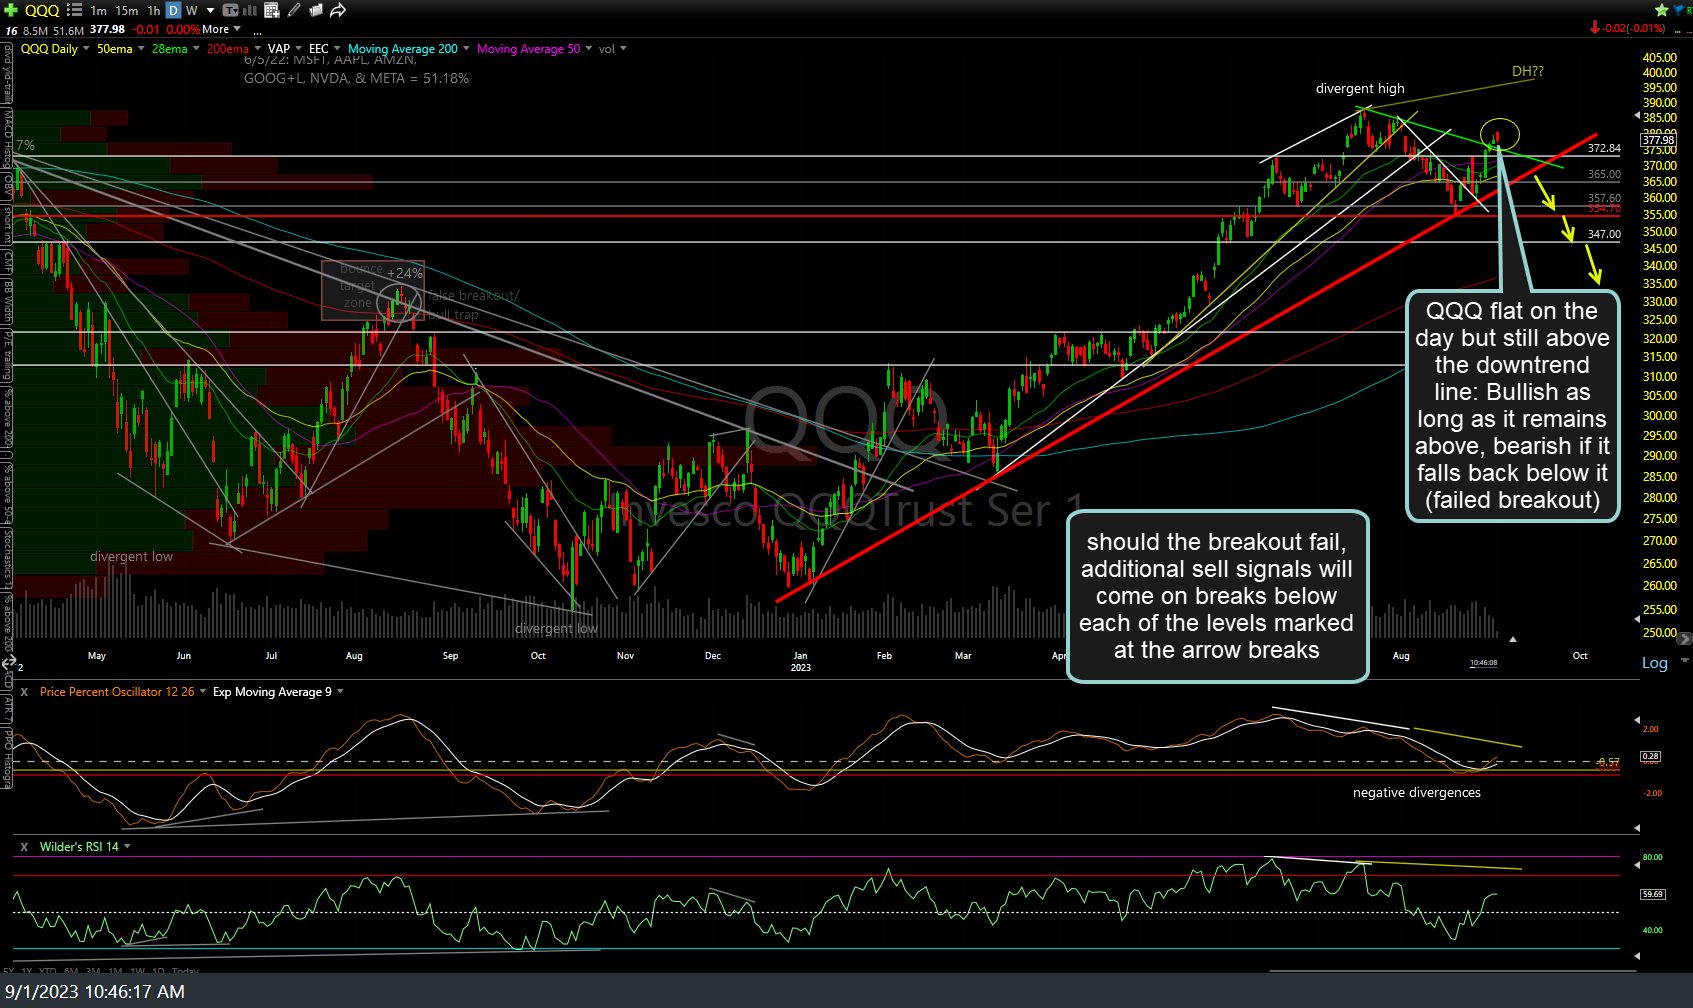
QQQ daily Sept 1st
/RTY (Russell 2000 Small-Cap Index futures contract) has rallied into the 1930ish resistance (top of my target zone) & just shy of the measured target for the 60-minute bullish falling wedge pattern highlighted earlier this week. Previous (Tuesday’s) and updated 60-minute charts below.
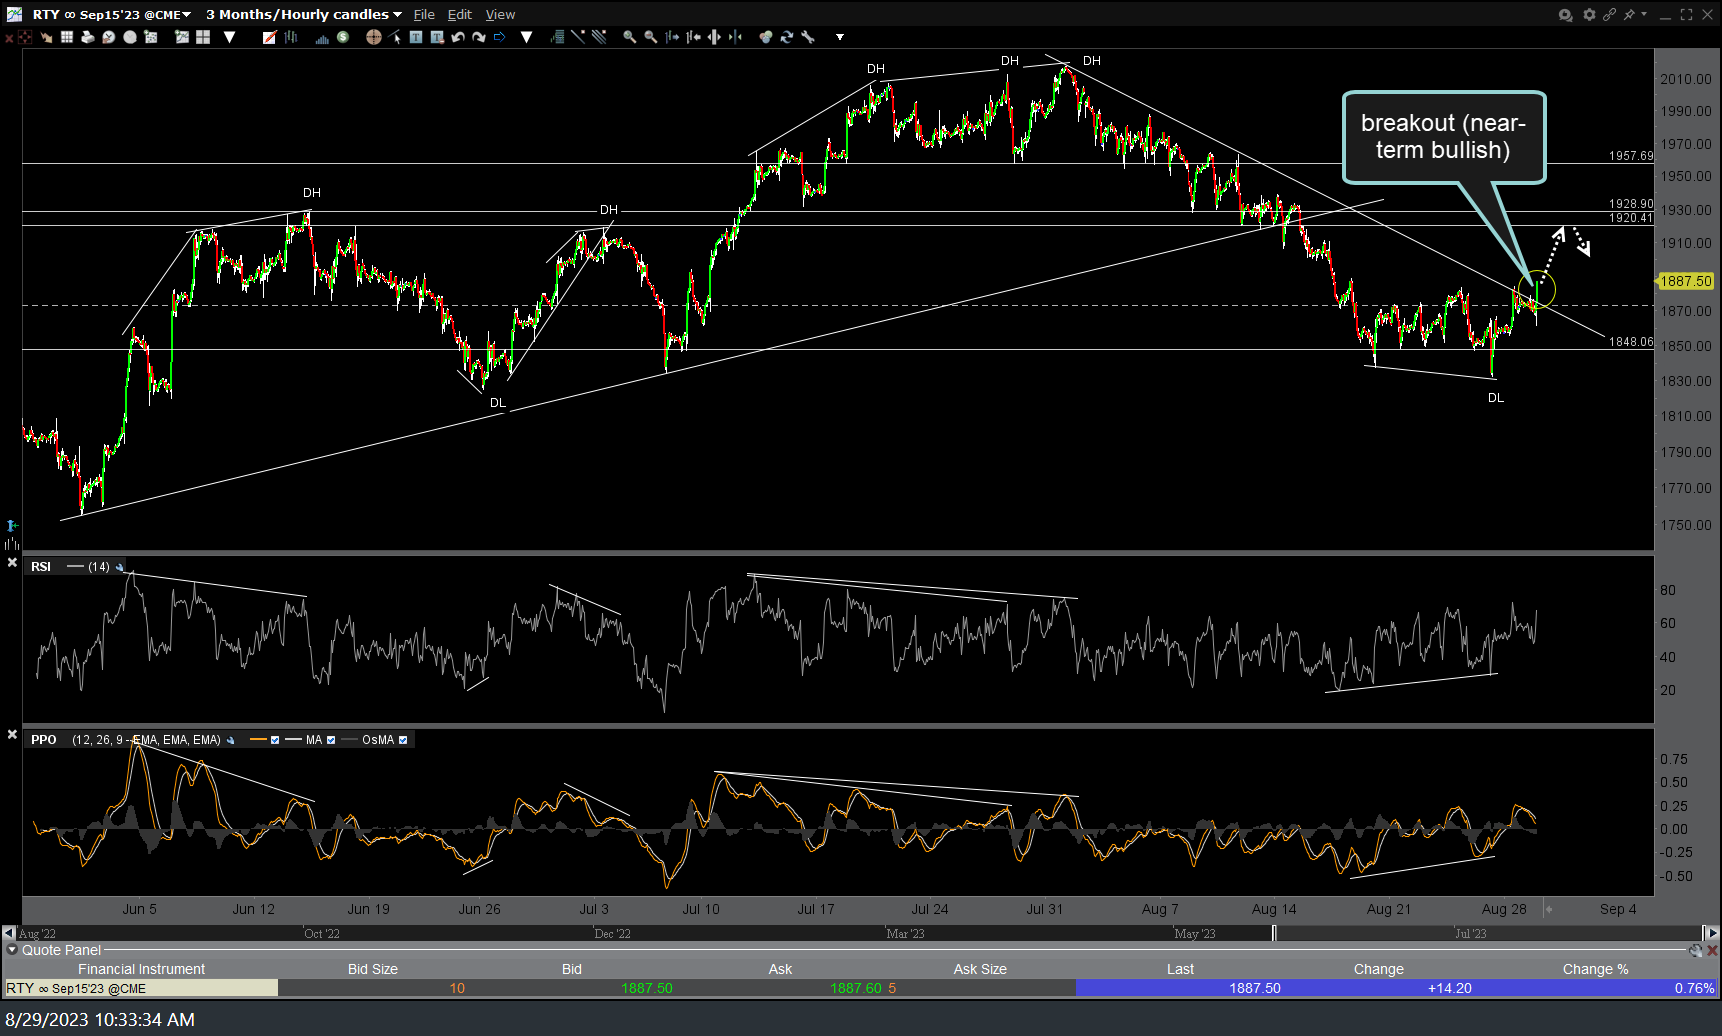
RTY 60m 2 Aug 29th
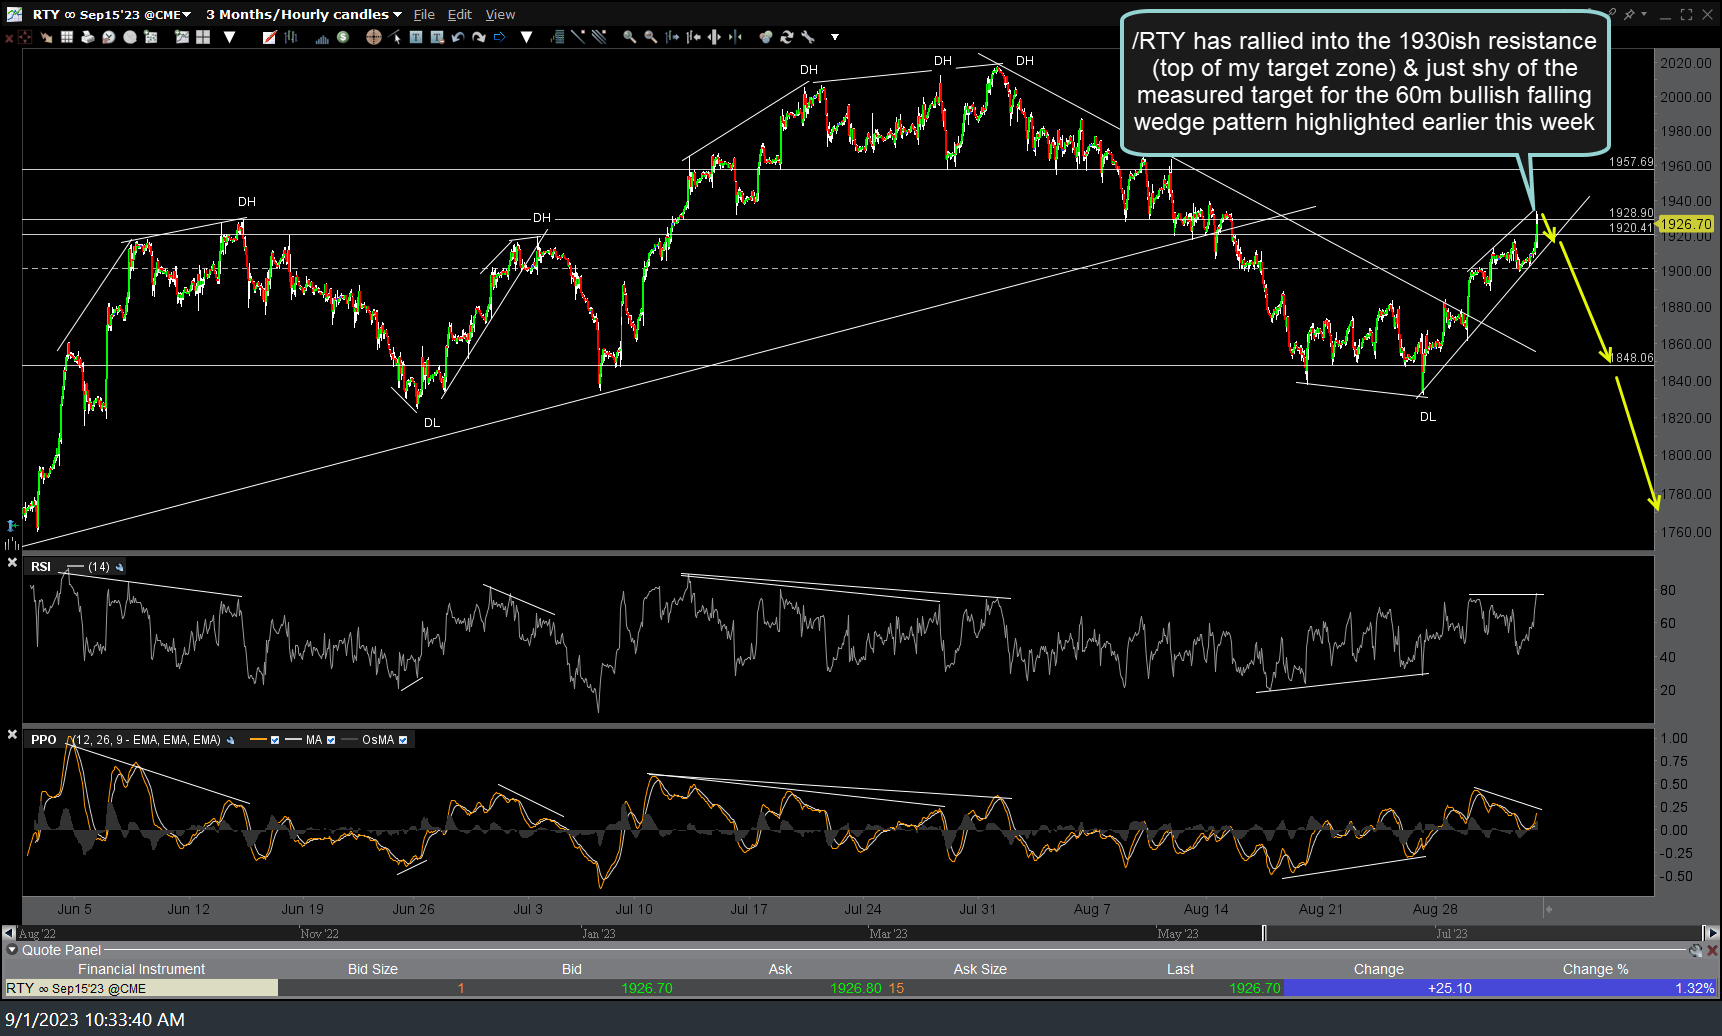
RTY 60m Sept 1st