
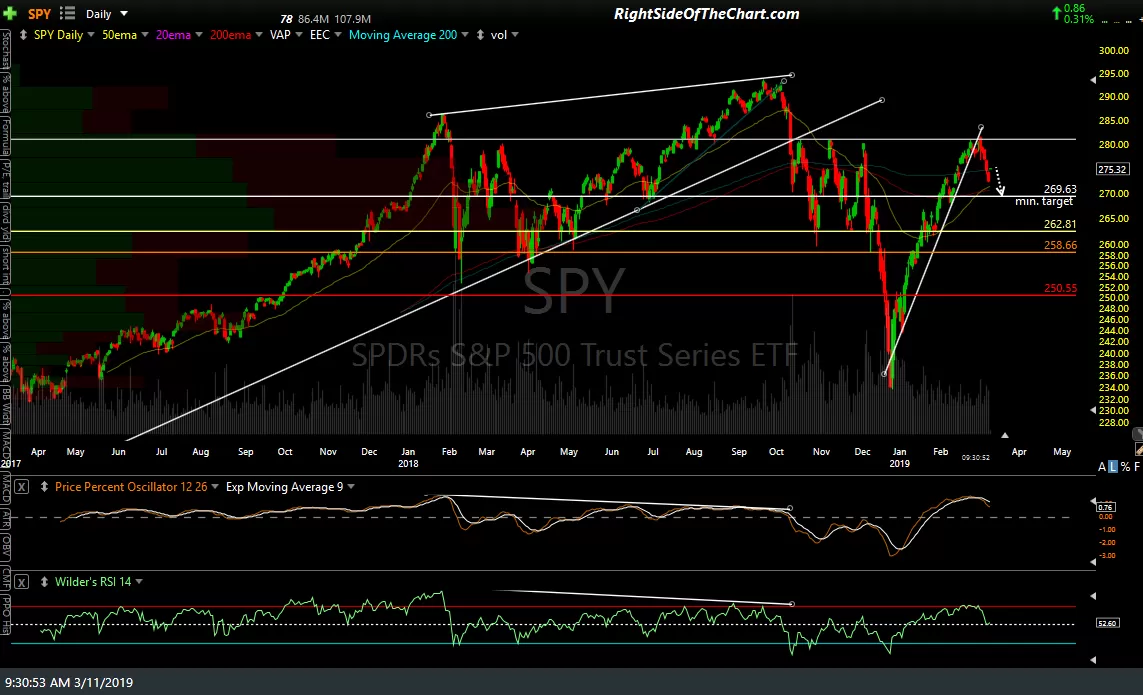
I’ve listed what I believe to be significant support levels on these daily charts of SPY & QQQ, color-coded by the degree of importance. For example, the white support lines show my minimum pullback targets, assuming that the stock market is headed above the 2018 highs before it tests or undercuts the Dec 2018 lows. As/if each of these support levels are taken out with conviction, that should open the door for a continued move down to the next level & so on.
-
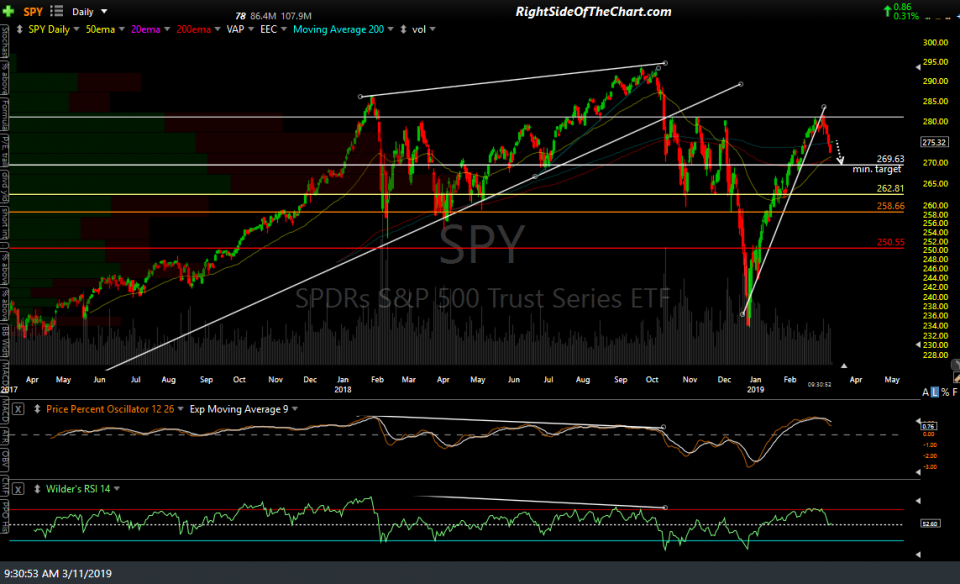
- SPY daily March 11th
-
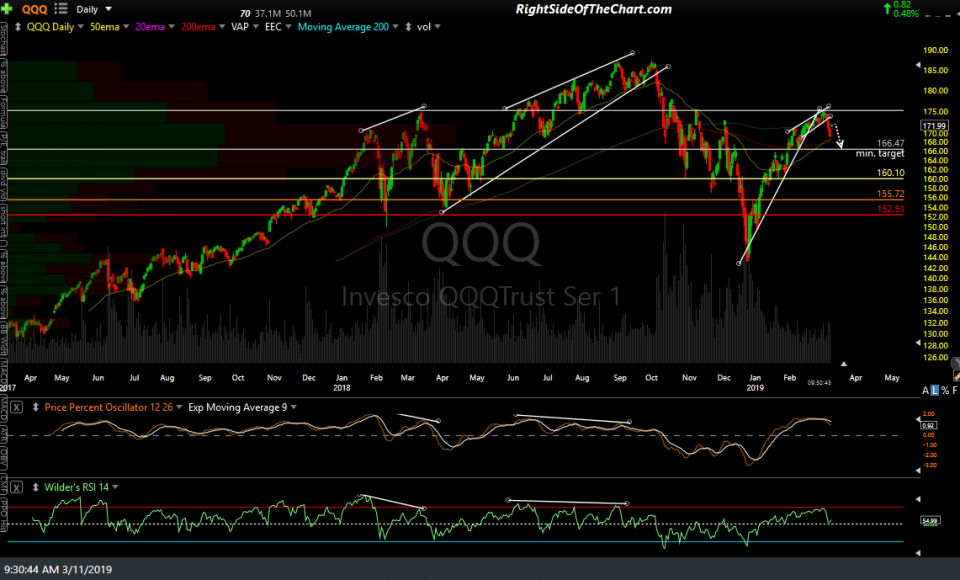
- QQQ daily March 11th
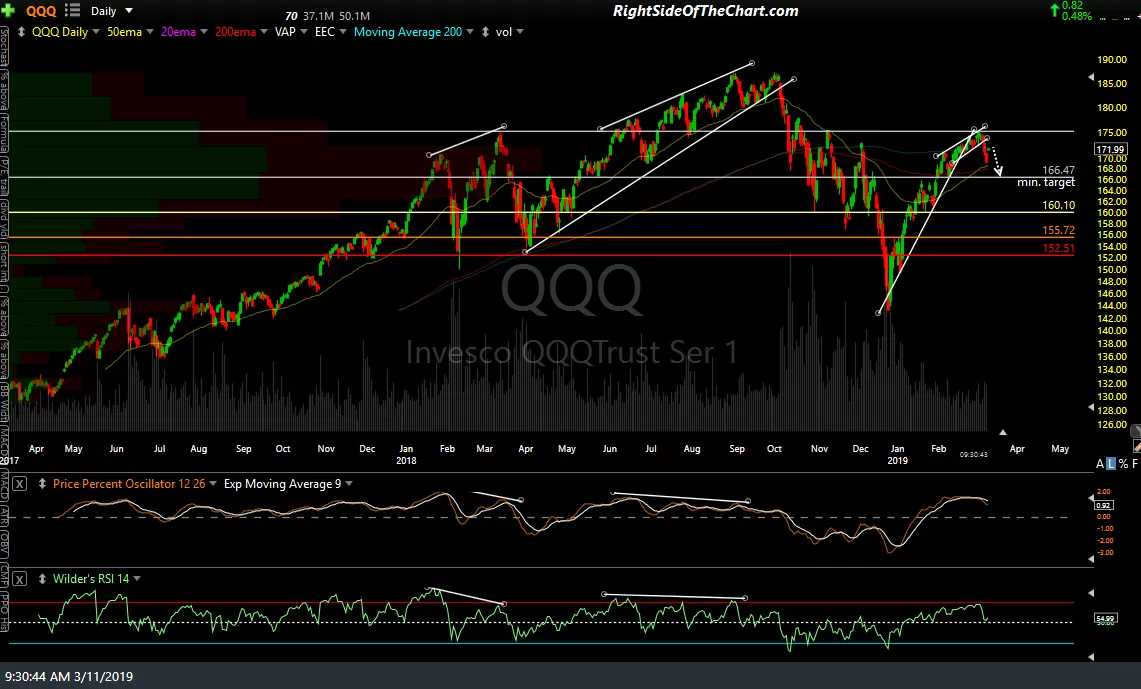
A break below the white support levels would still very much be within the realm of a typical & healthy correction following the strong advance off the Dec lows while a solid break of the yellow, orange, & red support would each substantially increase the odds that the rally off the Dec 24th lows was a bear market rally, with selling likely to accelerate if/as each of those levels are broken. A break below the red lines would also open the door to a waterfall type selloff (if one hadn’t already started before those levels were taken out) that would most likely blow right past the Dec 24th lows.
As far as the other direction (up), the most significant resistance levels to watch at this time are the highs from last Monday. Until & unless those levels are taken out, I am viewing any snapback rallies as objective opportunities to initiate or add to index short positions.