While the 60-minute charts of QQQ & SPY remain bearish, IWM (Russell 2000 Small Cap Index ETF) could mount at least a small rally should it make a convincing break above this 60-min bullish falling wedge pattern as the small caps approach support. Of course, support is support until & unless broken and as of now, IWM remains solidly in a near-term downtrend while trading below the downtrend line off the November 1st highs (top of wedge).
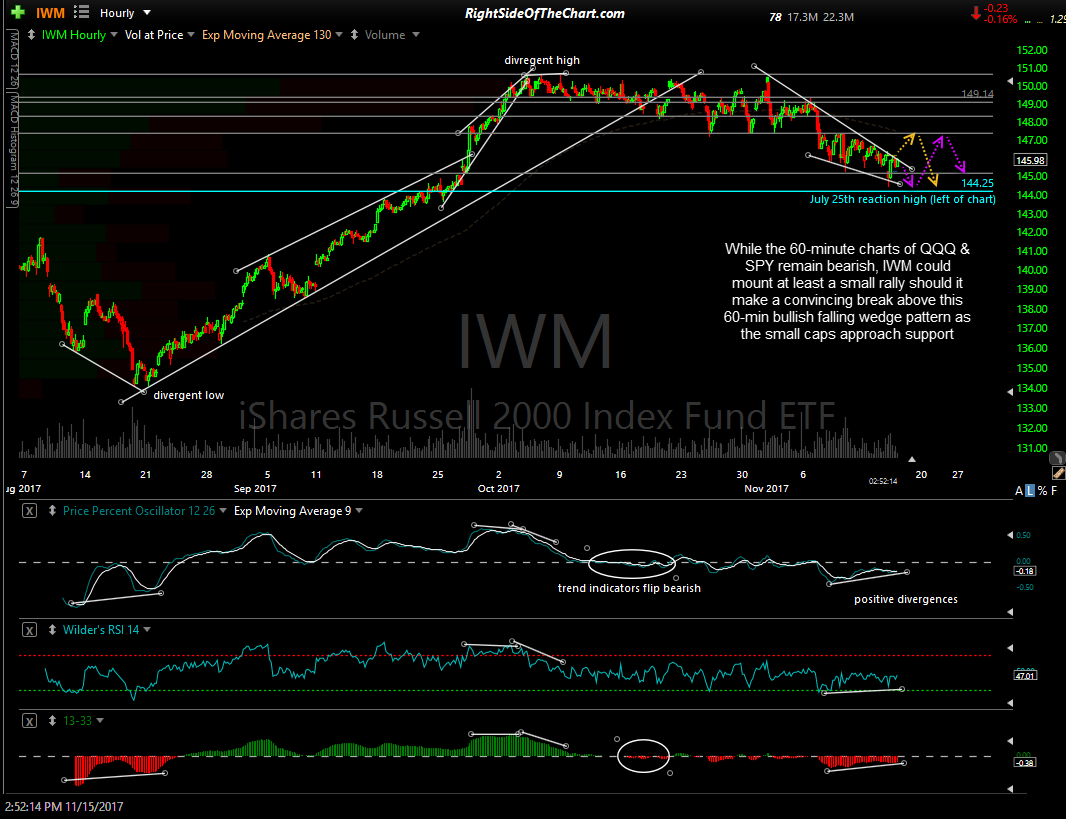
IWM 60-min Nov 15th
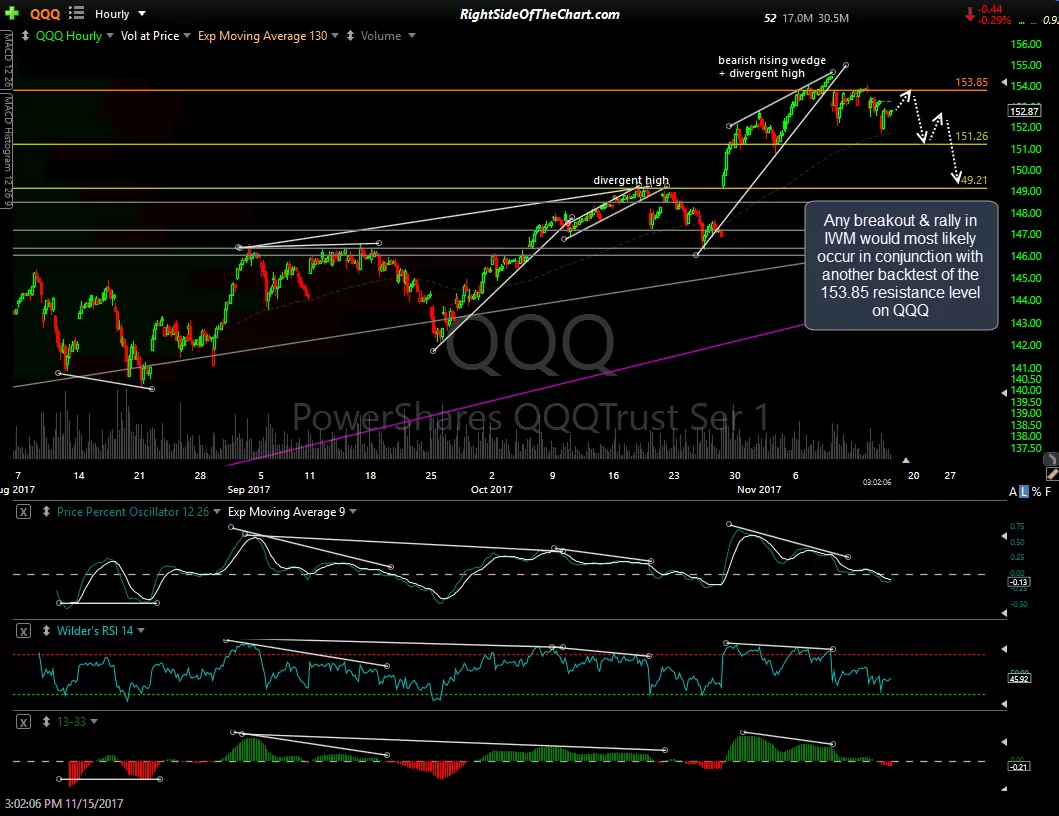
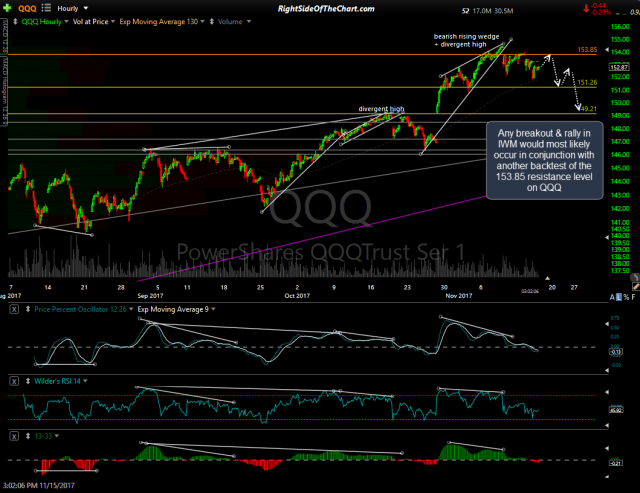
Orange scenario outlines a breakout soon while the purple scenario has prices continue to move down within the wedge for a while. Also note that while bullish divergences are forming on the 60-minute time frame, both the PPO signal line & the 13/33ema histogram clearly remain below zero confirming the intermediate-term trend remains bearish for now. Should IWM break out, the first targets & likely stopping points for any rally would be 147.43 then 148.37 (first two horizontal lines overhead). Likewise, any breakout & rally on IWM would most likely coincide with a backtest of the 258.39 resistance level on SPY as well as the 153.85 resistance level on QQQ (60-minute charts).
-
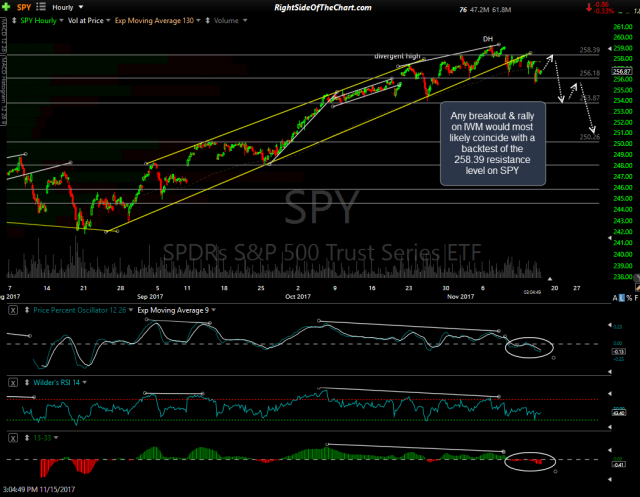
- SPY 60-min 2 Nov 15th
-
- QQQ 60-min 2 Nov 15th