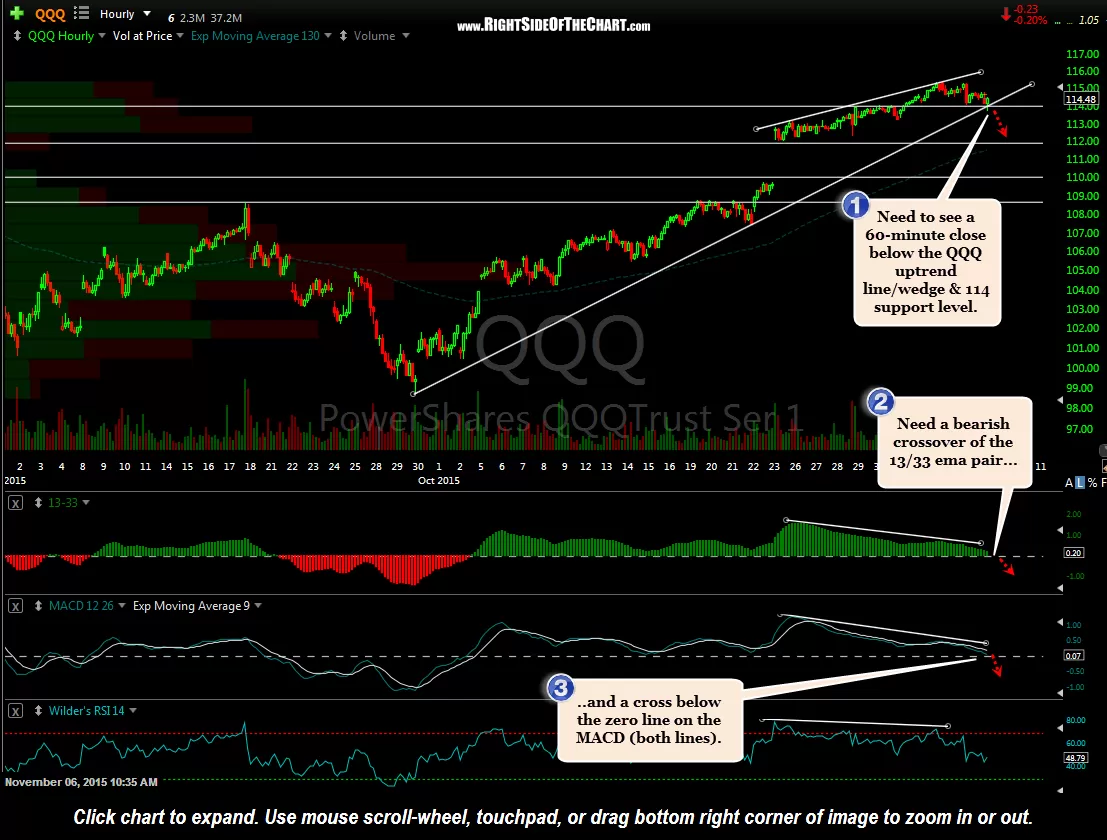
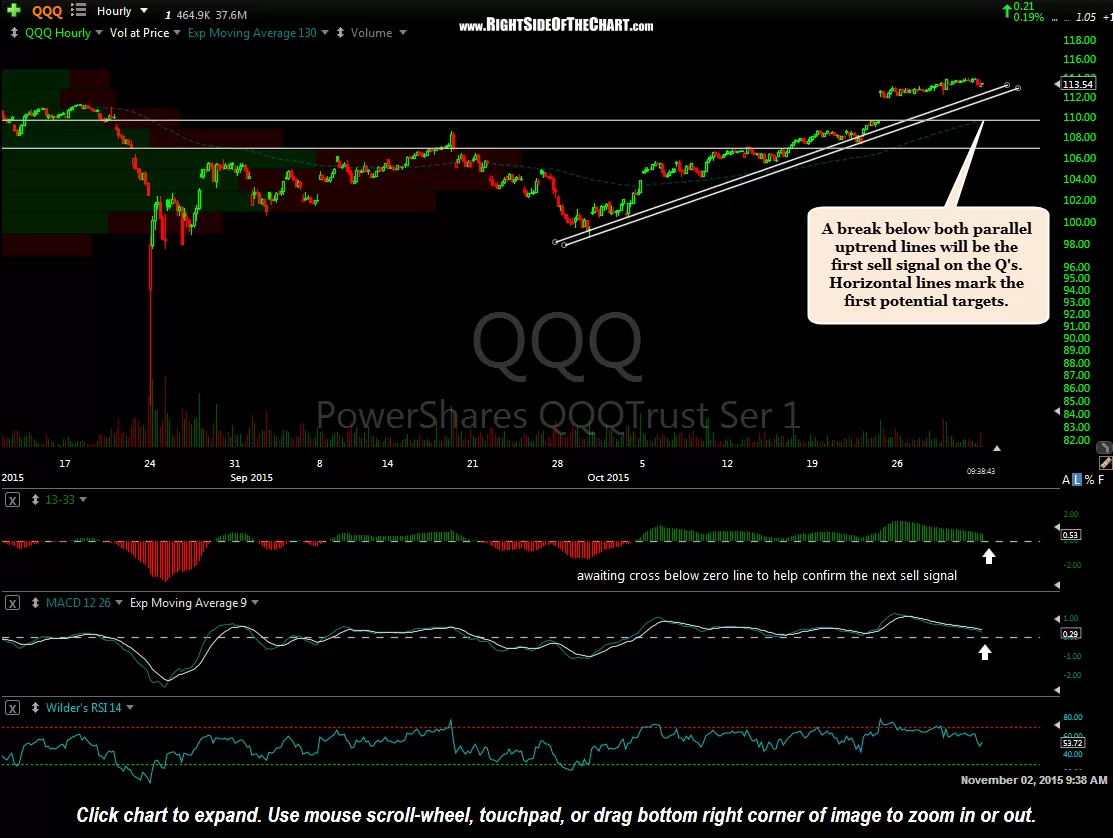
In the last update showing the SPY 60-minute, I was neglect in not mentioning, as I did in Monday’s Awaiting These Sell Signals on the QQQ & SPY post, that until the leading index, the $NDX / QQQ breaks down, that the rest of the US indices aren’t going down very far without the lead dog that has been pulling the sled for months & even years now. Here’s the updated 60-minute chart of the QQQ with what we need to see before we get a green light (or red light, depending if you are long or short) along with Monday’s QQQ chart (I’ve since removed the upper-most TL & added a few more support/target levels).
I should have pointed out that the Q’s were flirting with that key 60-minute uptrend line when I posted the SPY update earlier but I was so wrapped up in the 5 & 10 minute charts of QQQ that I forgot to check my “60”. The Q’s did briefly overshoot that wedge but as I often state, only the 60-minute candlestick closes matter when trading off a 60-minute time-frame. So far, they buyers have stepped in at that TL but I still believe that a breakdown & substantial move lower are imminent at this point (although so far, the market has already topped on Tuesday & so I believe that we are already most likely well into the very early stages of a correction).
-
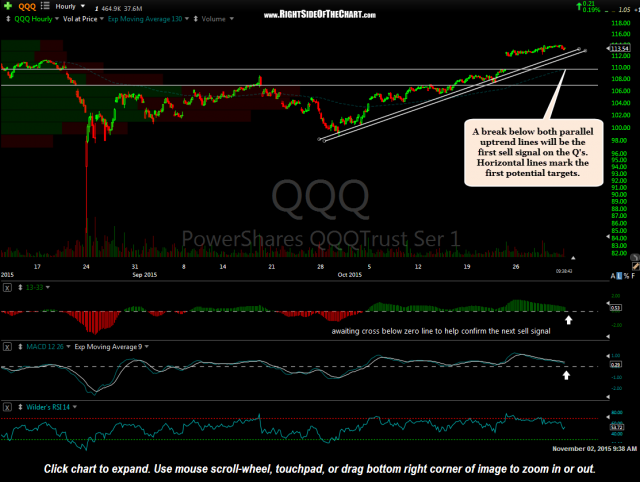
- QQQ 60 minute Nov 2nd
-
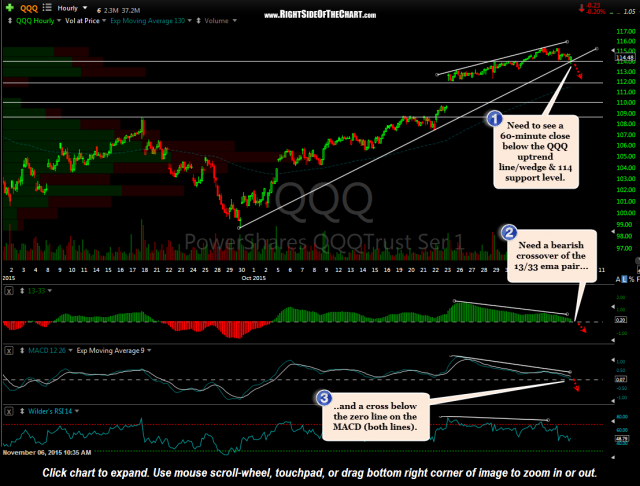
- QQQ 60 minute Nov 6th